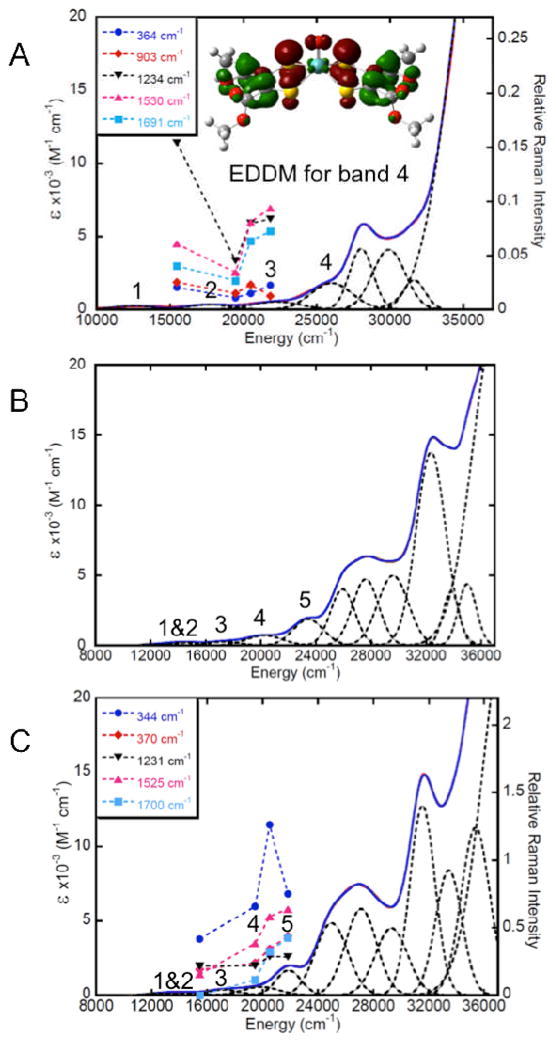
Fig. 13.

Gaussian resolved solution electronic absorption spectra for MoOLCOOMe (A), MoSLCOOMe (B), and MoSeLCOOMe (C). Resonance Raman excitation profiles for MoOLCOOMe and MoSeLCOOMe are overlayed on their respective absorption spectra. An electron density difference map that details the nature of the intraligand transition (HOMO-1→LUMO+1) in MoOLCOOMe (red: electron density loss in transition, green: electron density gain in transition) is presented in A (inset).
