
Figure 2.
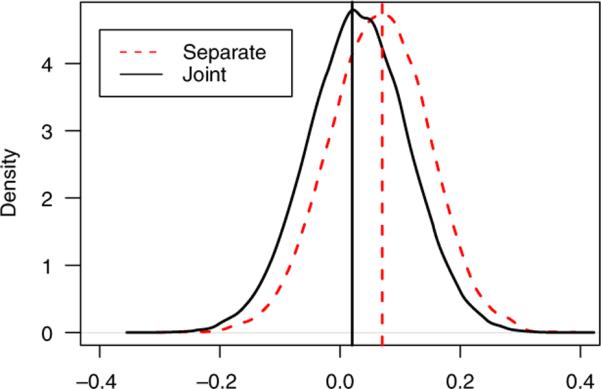
Posterior densities of time trend for the CYC group in the SLS study from the separate models and the proposed joint model. The vertical lines represent the posterior medians. The estimates and CIs for the two methods are: 0.07(−0.10, 0.22), 0.03(−0.14, 0.19), respectively.