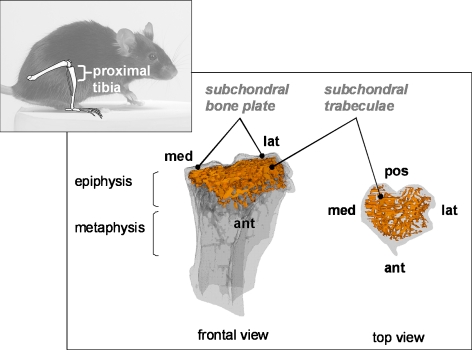
Fig. 1.
Analysis of bone phenotype of WT and TTD mice. Anatomical context with the analyzed region (proximal tibia) is indicated in the smaller panel. The larger panel shows a transparent 3D model of the proximal tibia. The subchondral (epiphyseal) trabecular bone structure is indicated in orange (left: frontal view, right: top view). The model was build from a transaxial stack of cross-sections of 10 μm thickness. Med medial, lat lateral, pos posterior, ant anterior

