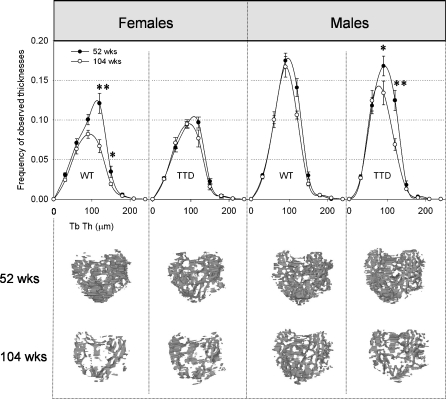
Fig. 4.
Top panel thickness distributions of epiphyseal trabecular bone in female and male WT and TTD mice, aged 52 and 104 weeks. The number of observations of a measured thickness were counted and pooled in intervals of 30 μm of thickness. Please note that area under the curve depicts the total amount of trabecular bone (Trab BV). Trab BV in males is higher compared to females, since males are larger animals, but this is compensated by TV (not shown) and both sexes therefore have similar Trab BV/TV ratios as depicted in Fig. 2a, *p < 0.05, **p < 0.01, 52 vs. 104 weeks. Bottom panel 3D visualizations of the epiphyseal trabecular bone structure, as viewed from the top. The anatomical positioning is the same as shown in Fig. 1 (right)

