Figure 3.
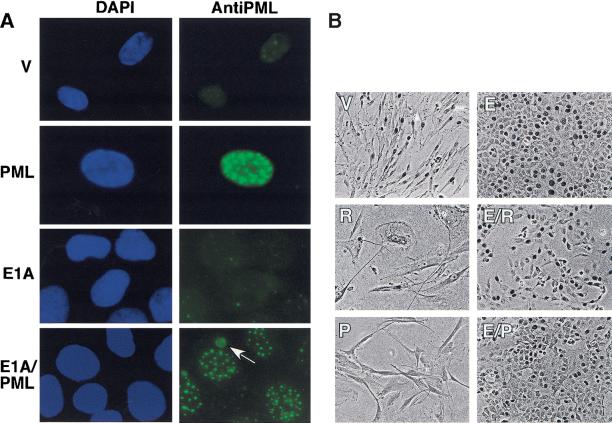
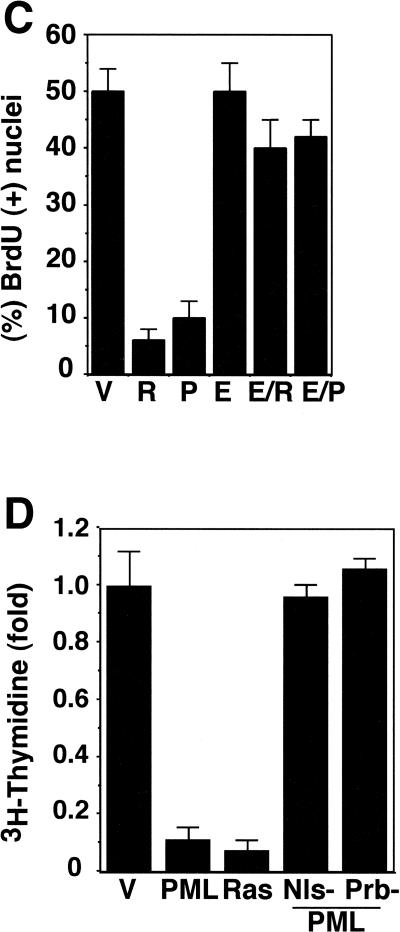
Impact of enforced PML expression on IMR90 cells. (A) IMR90 cells or IMR90 cells expressing E1A were infected with a control vector (V) or a virus expressing PML. PML staining and POD structure were visualized by indirect immunofluorescence using 4′6-diamidino-2-phenylindole (DAPI) staining to highlight the nucleus. Representative samples are shown. The arrow in the bottom right panel (E1A) points to a cytoplasmic PML conglomerate. (B) Cell morphology and in situ bromodeoxyuridine (BrdU) incorporation of control IMR90 cells or E1A-expressing IMR90 (E1A) cells infected with an empty vector (V), or viruses expressing oncogenic ras (R) or PML (P). The cells were pulsed with 10 μm BrdU for 2 hours a day 4 postselection, and BrdU incorporation was visualized using immunohistochemistry. (C) Quantitation of the results presented in B, showing the percentage of BrdU-positive nuclei. The average and standard deviation of three independent counts of 200 cells are shown. The abbreviations are as follows: (V) vector; (R) oncogenic ras; (P) PML; (E) E1A. (D) 3H-thymidine incorporation in cells containing a vector control (V), PML, oncogenic ras, or two PML mutants, PML Nls- and PML prb-. All cell populations were pulsed with 3H-thymidine for 24 hours, beginning 3 days postselection and the amount of incorporation was measured as described in Materials and Methods. Each point represents the mean ± standard deviation of data obtained in three independent experiments.


