
Figure 4.
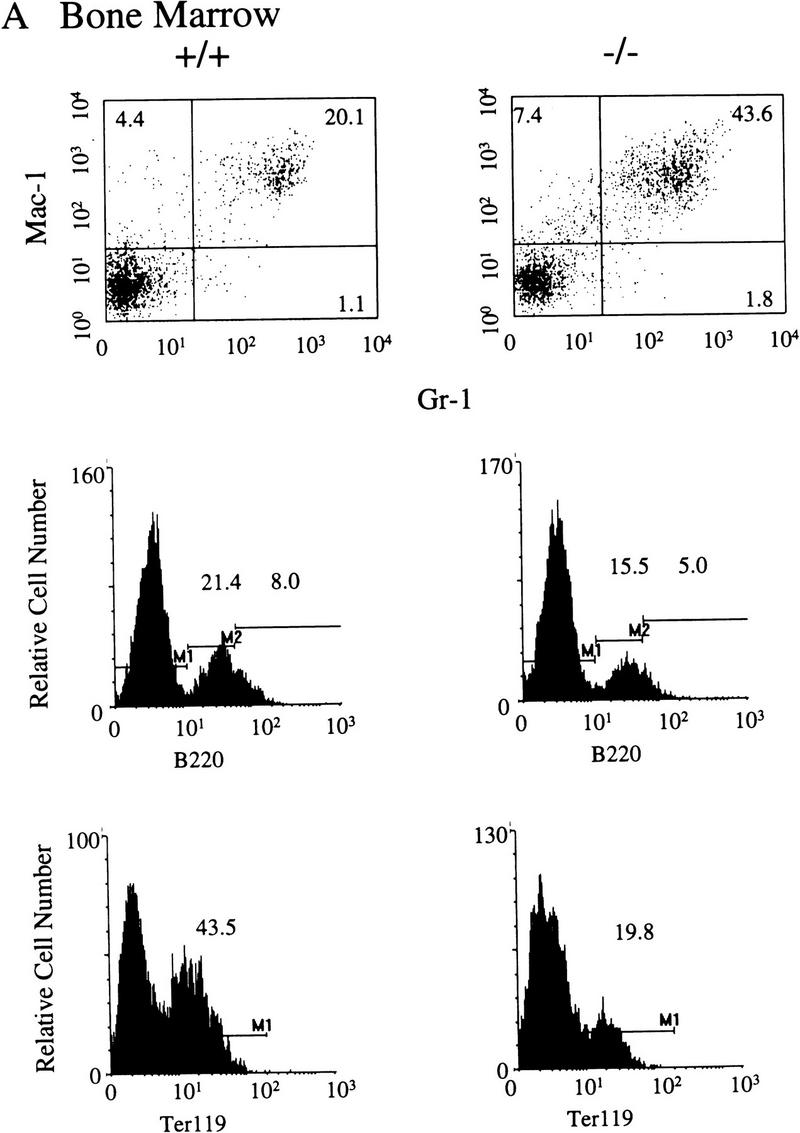
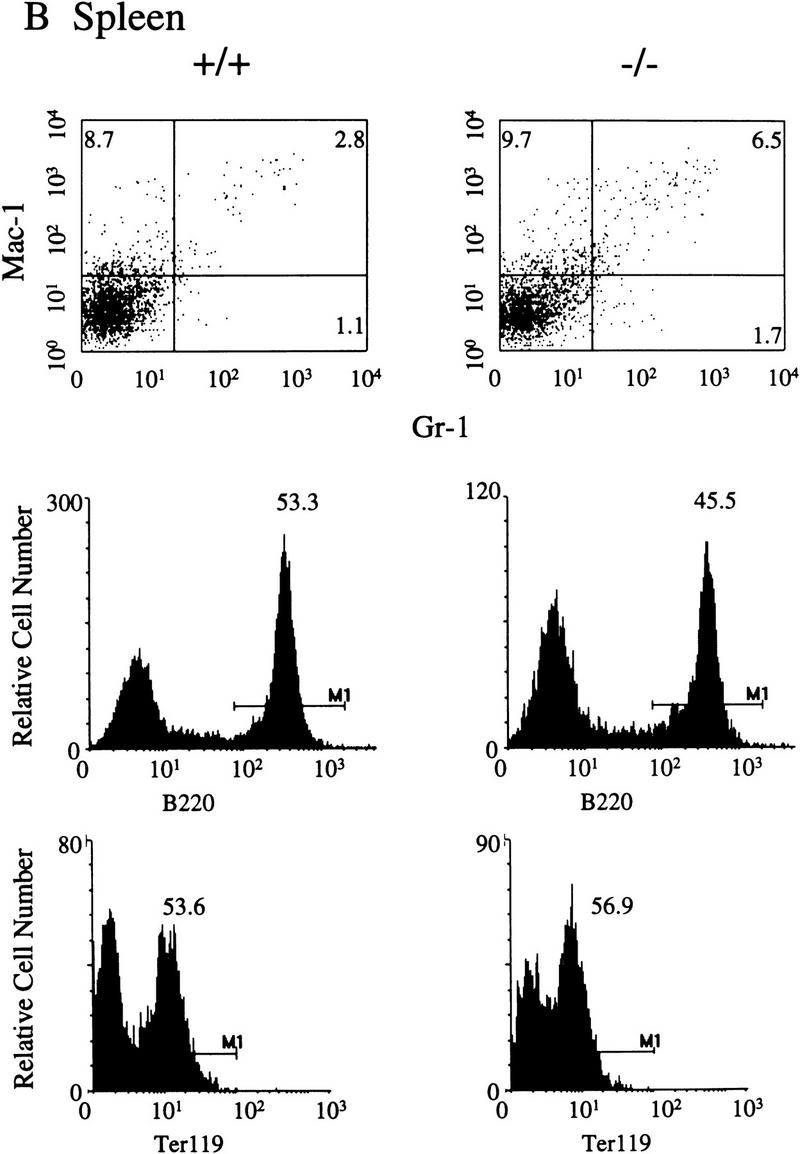

Representative FACS profiles of 4–5-week-old SHIP F2 mice. Five mice of each genotype were analyzed and the average percentages of positive cells determined. A FACS profile representative of each of these values is presented for bone marrow (A), spleen (B), and thymus (C) of SHIP wild-type (+/+) or null (−/−) mice. Numbers represent the percent of viable (PI−), positively stained cells within each marked region.