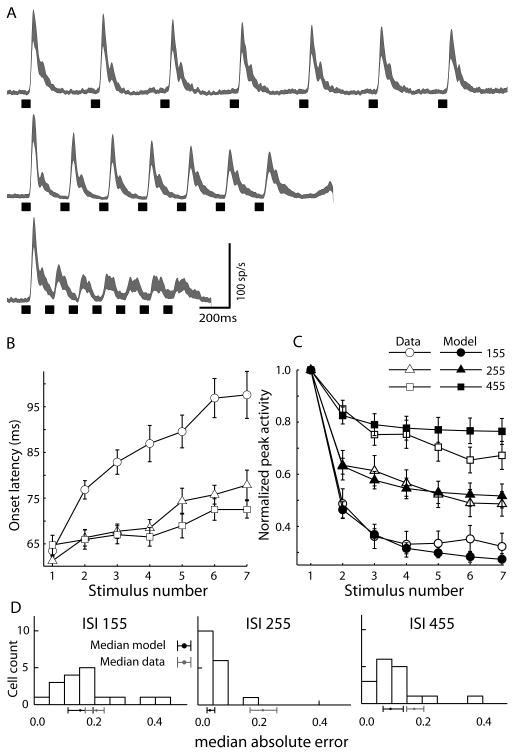
Figure 4.
Effect of changing interstimulus interval (ISI) on the repetition effect. A. Population spike density waveforms recorded from 17 visually responsive neurons in the SC in response to 7 stimuli (55ms) presented with ISIs of 155, 255, 455 ms. As ISI increased, the repetition effect was reduced. At short ISIs the response onset latency (B) was increased and peak response magnitude (C) was decreased with stimulus repetition. Without changing the parameters used to generate the model fit to control trials (Fig.3c), the model (closed symbols) predicted the neurons peak response magnitude (open symbols) across the different rates of stimulus presentation (two-factor repeated measures permutation-test, p = 0.89). D. The paired-error test (see Methods) indicated that, on average, each model was a better predictor of the peak activity of its corresponding real neuron, than other neurons of the same class (p<0.01). Histograms of median absolute errors between each neuron and its corresponding model for the three ISI conditions are shown in (d). The black dot and line below each axis show the median error and 95% bootstrapped confidence interval (30,000 iterations) of model errors. The gray dot and line show the median error and 95% bootstrapped confidence interval from the distribution of pairwise errors between actual neurons (see Methods). Notice that in all cases the models' median error is less than the median error between neurons.

