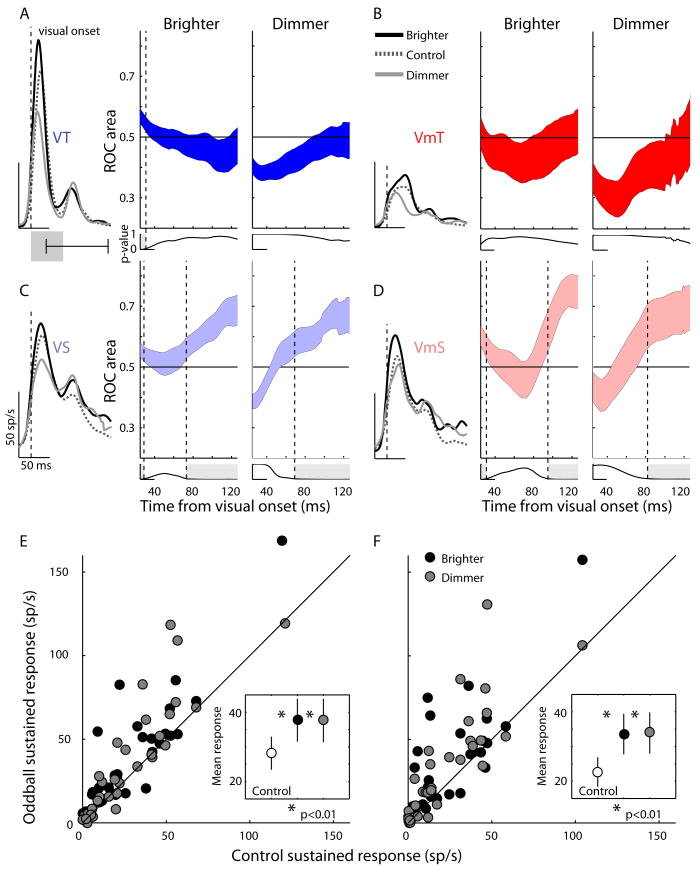
Figure 6.
Changes in the later sustained part of visual response to oddball stimuli presented in the 4th stimulus position are shown for each neuron type A: VT; B: VmT; C: VS, D: VmS. An ROC analysis was performed to determine at what points in time the later (sustained) part of the visual response became significantly different between control trials and either brighter or dimmer trials. The overlaid spike density functions show the average activity for the control, brighter, and dimmer conditions aligned to the onset of the transient visual response (see Methods) to the 4th stimulus. The filled colored regions represent the standard error of the ROC area across all cells of the same class, for the brighter and dimmer conditions separately. A ROC area of 0.5 or less indicates no difference between the control and oddball conditions at that particular time point, while values greater than 0.5 indicate the oddball condition had more activity on average. Each point was tested with a 1-tailed t-test to determine if the ROC area was significantly greater than 0.5. The p-value of this test is plotted below each ROC area plot and the vertical dotted lines and light gray shaded regions indicate when the p-value crossed the significance threshold (p<0.05). All ROC area's for all time points were normally distributed (Kolmogorov–Smirnov, p<0.05). E. Scatterplot of the mean sustained activity for the 4th stimulus in control trials vs. mean sustained activity in the brighter or dimmer oddball stimuli for VS neurons. Inset graph shows the population mean sustained activity with standard error bars for the control, brighter and dimmer stimuli. Asterisk shows significant difference between oddball and control activity rates (paired t-test, 1-tailed). F. As described in E, but for VmS neurons.

