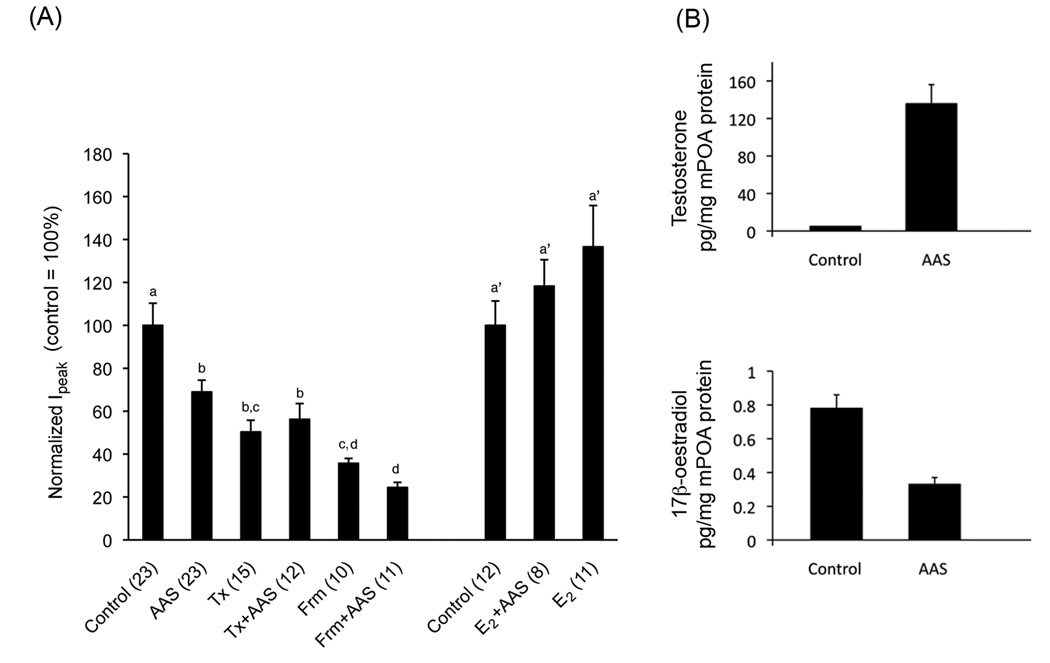
Figure 3.
AAS Antagonism of Endogenous ER Signalling in the AR-deficient Tfm Mouse. (A) Graphical representation of averaged peak sIPSC amplitude from Tfm mice chronically treated with oil alone (Control), the AAS mixture in oil (AAS), tamoxifen (Tx), the AAS cocktail and tamoxifen (Tx+AAS), formestane (Frm) the AAS cocktail and formestane (Frm+AAS), 17β-oestradiol and the AAS cocktail (E2+AAS) or 17β-oestradiol alone (E2). Identical letters indicate means that were not statistically different from one another as assessed by two-way ANOVA followed by the means comparison by least significant means. Numbers in parentheses indicate numbers of cells. (B) Means ± standard errors of the mean levels of testosterone (T) and 17β-oestradiol (E2) in mPOA tissue harvested from control (n = 6 mice for T; n = 8 mice for E2) or AAS-injected (n = 4 mice for T; n = 8 mice for E2) Tfm male mice. Data are modified from Penatti et al. [84].

