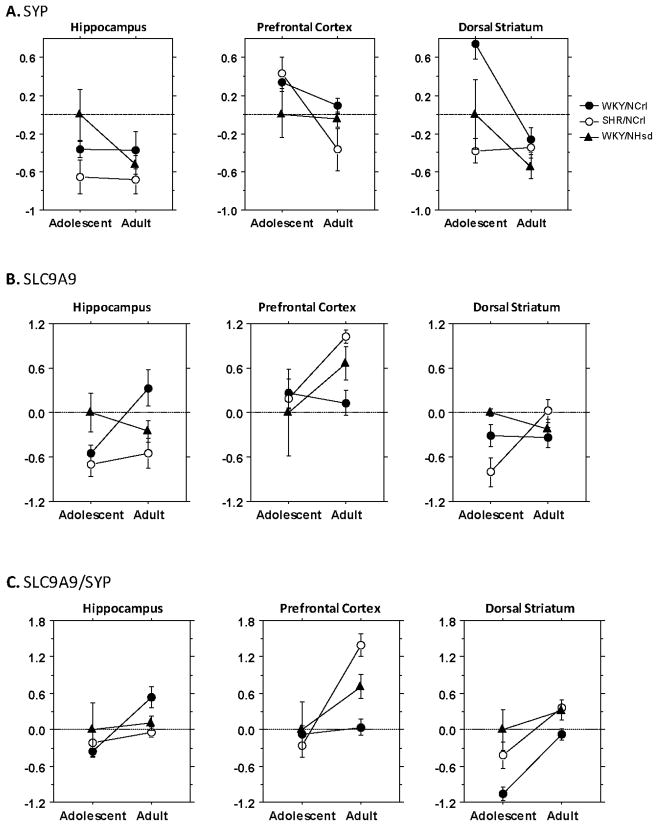
Figure 1. Developmental expression profile of SYP and SLC9A9 in ADHD rat models.
A. Relative levels of SYP expression (log2 difference) in each brain regions were calculated using ΔΔCt methods with the adolescent WKY/NHsd rats as baseline level in each brain region. B. Relative levels of SLC9A9 expression (log2 difference) in each brain region were calculated using ΔΔCt methods with the adolescent WKY/NHsd rats as baseline level in each brain region. C. The log2 difference of SLC9A9 vs synaptaphysin (SLC9A9/SYP ratio) in each brain region was calculated using ΔΔCt methods.

