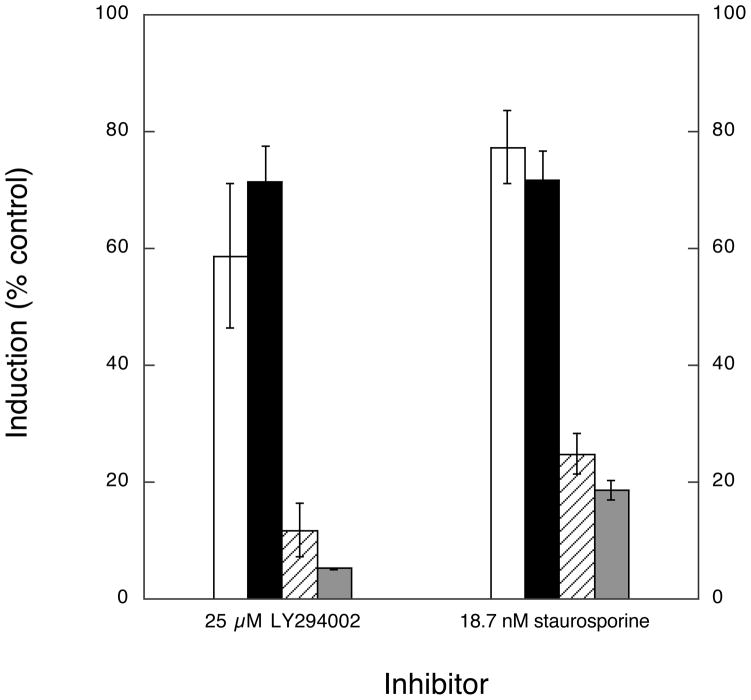
Fig. 8. Resolution of NA-induced ARE/Nrf2 versus PPRE/PPARγ transcription programs by the preferential inhibition of ARE/Nrf2 activity with inhibitors of PI3K and PKC.
Cells were co-transfected with PPRE-driven and ARE-driven reporters according to transfection scheme 2 (Experimental Procedures). Transfected cells were treated with 10 μM NA (12-NO2-LA), 10 μM SFN, or 5 μM RSG ± inhibition with the PI3K or PKC selective inhibitors, LY294002 or staurosporine, as shown. Data is expressed as % maximum fold induction (minus inhibitor) ± 1 sd (n=3). PPRE/PPARγ-driven transcription: shown are cells treated with RSG (open bars) and 12-NO2-LA (black bars). ARE/Nrf2-driven transcription: shown are cells treated with SFN (cross-hatched bars) and 12-NO2-LA (shaded bars).

