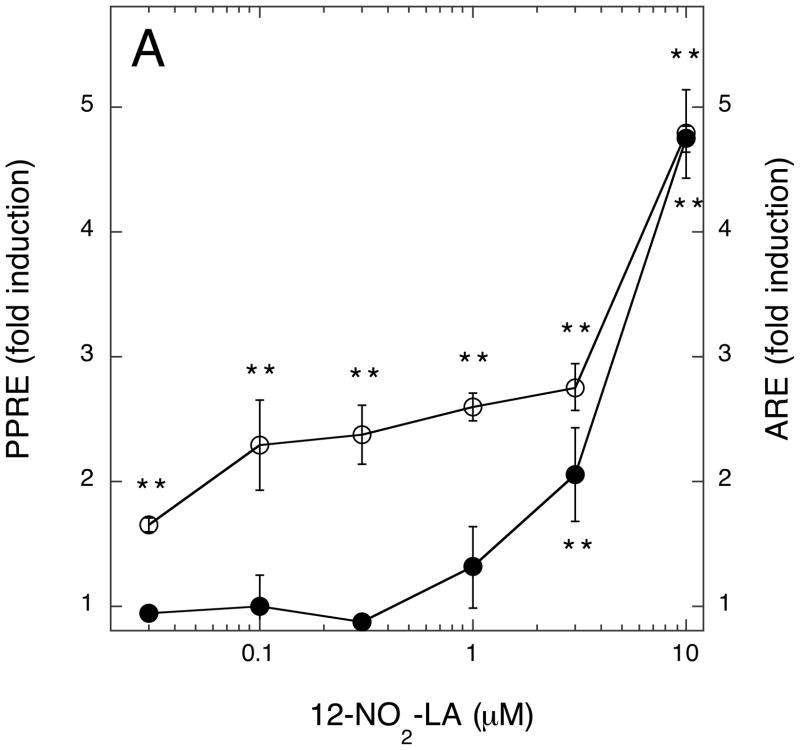
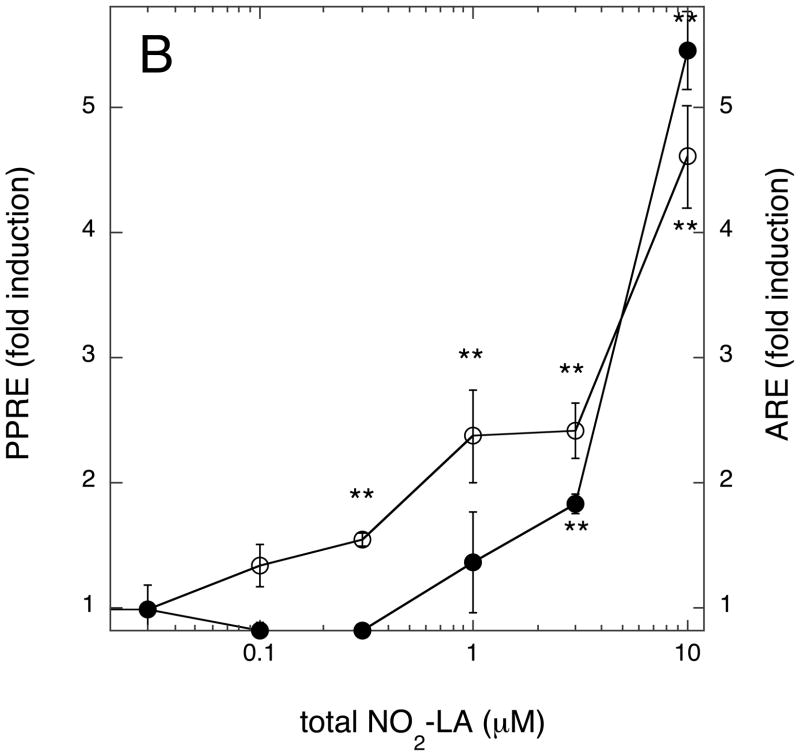
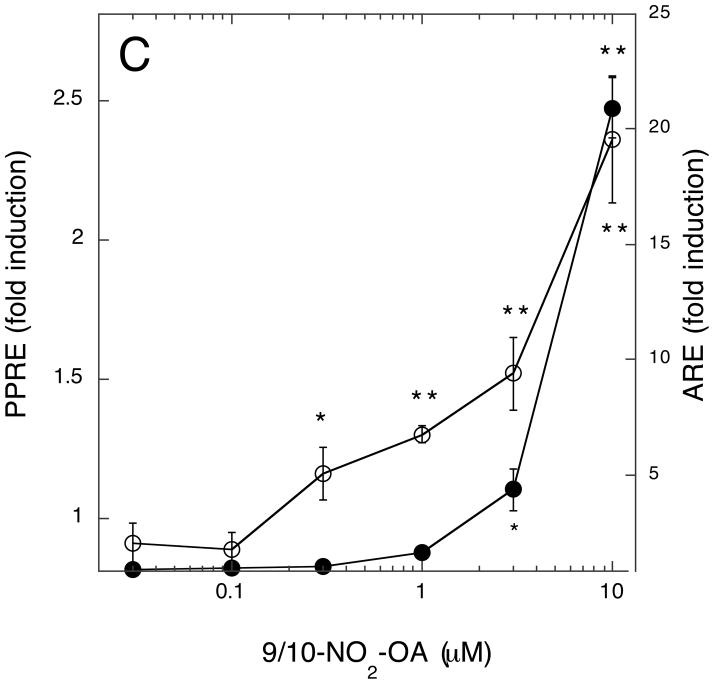
Fig. 9. Concentration-dependence of NA-mediated induction of ARE/Nrf2- versus PPRE/PPARγ-driven transcription programs.
Cells were transfected with ARE or PPRE reporter genes according to transcription scheme 1. Transfected cells were treated for 3 hr with the indicated concentrations of NAs—12-NO2-LA (panel A), total NO2-LA (panel B), or 9/10-NO2-OA (panel C). Medium was then replaced (minus NA) and cells harvested for luciferase determinations, corrected for variations in transfection efficiencies, 12 hr later. Data is expressed as fold induction (luciferase activity with NA ÷ luciferase activity without NA) for PPRE/PPARγ-dependent (open circles) or ARE/Nrf2-dependent (closed circles) reporter gene activity ± 1 sd (n=3–4). NA-induced values that are significantly different from un-induced controls are indicated: *, P<0.05; **, P<0.01 (unpaired, two-tailed t test with Welch correction, GraphPad InStat3).


