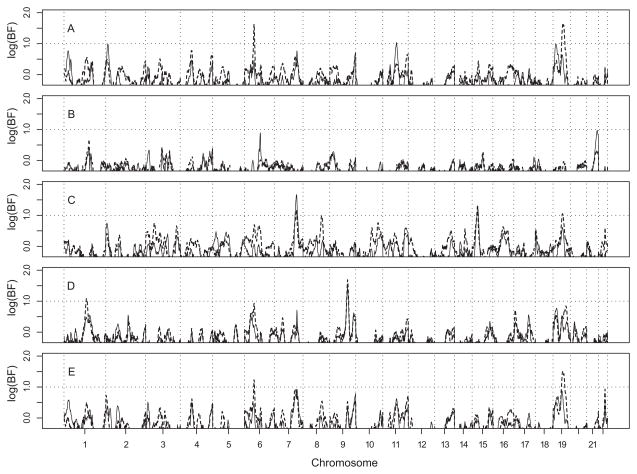
Figure 2.
Genome scan for age-at-onset of AD. For each panel, dashed line: log(BF) obtained without adjustment for APOE; Solid line: log(BF) obtained with adjustment for APOE as a major gene covariate. Panel A: All1; B: Center 50; C: Center 51; D: Center 52; and E: All3. Vertical dotted lines depict boundaries between chromosomes; horizontal dotted line is at logBF=1. See Supplementary Figure 2 for a color version.

