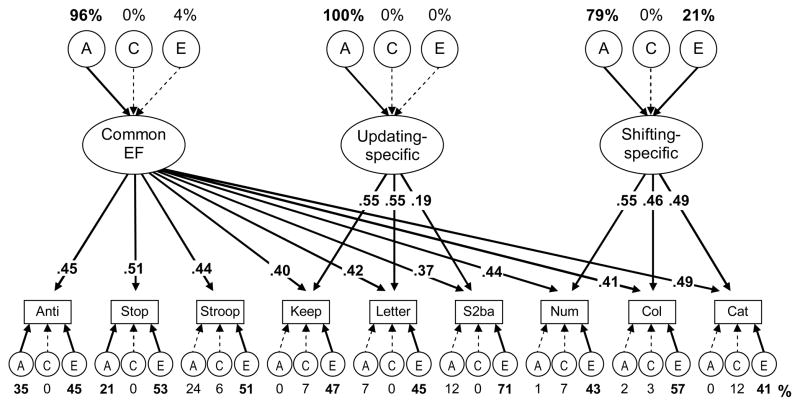
Figure A1.
Nested factors multivariate executive function ACE model. Numbers above the top ACEs are the percentages of the Common EF, Updating-specific, and Shifting-specific factors’ variances due to genetic and environmental influences. The numbers occluding arrows are standardized factor loadings. Numbers below the lower ACEs are estimates for the remaining nonexecutive variances in individual tasks. Boldface type and solid lines indicate p < .05. Anti = antisaccade, Stop = stop-signal, Keep = keep track, Letter = letter memory, S2ba = spatial 2-back, Num = number-letter, Col = color-shape, Cat = category-switch.

