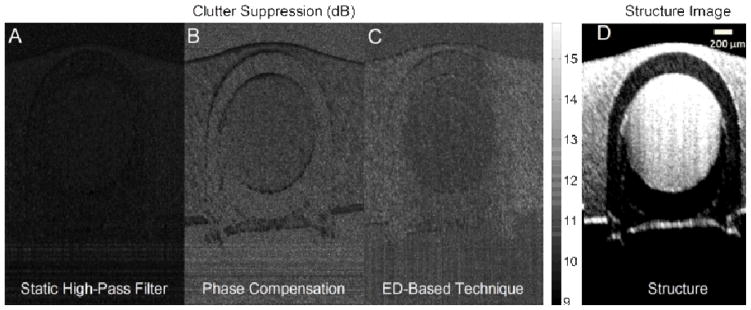
Fig. 3.
Typical performance of clutter rejection filters in flow phantom studies. (A) static high-pass filter, (B) phase compensation and (C) ED-based technique. The flow pipe is located in the center, surrounded by tissue material. The intensity values correspond to the suppression level after clutter rejection. Higher suppression outside the tube (more bright) and lower suppression inside the tube (less bright) is preferred. (D) Structure image, which is blurry because of the motion introduced by tapping over the imaging surface to simulate tissue motion.

