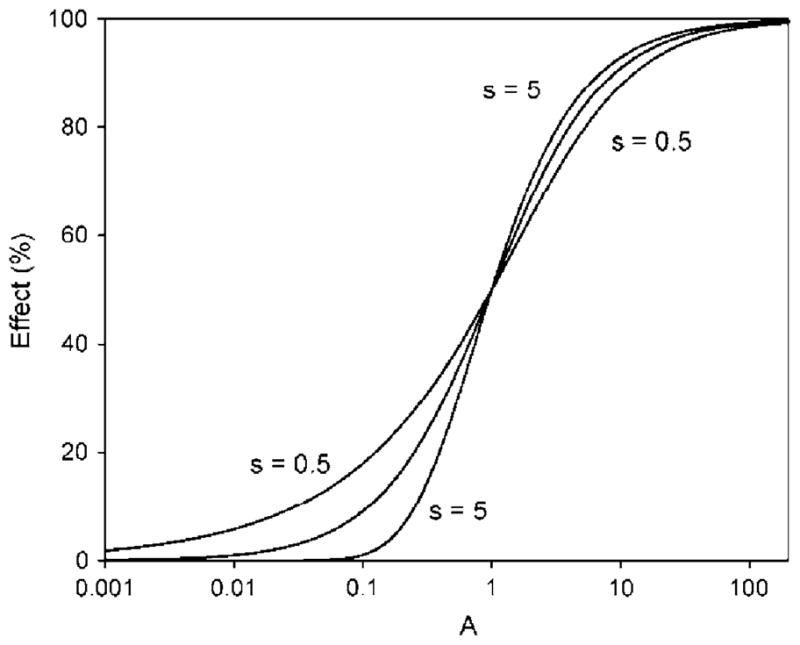
Fig. 1.

Theoretical concentration-response curves developed for three asymmetry (s) parameter values: 0.5, 1.0 (middle curve), and 5.0. The middle curve is symmetrical, and the others are asymmetrical. Curves with s < 1 show a greater bowing effect at low concentrations; those with s > 1 show bowing at high concentrations
