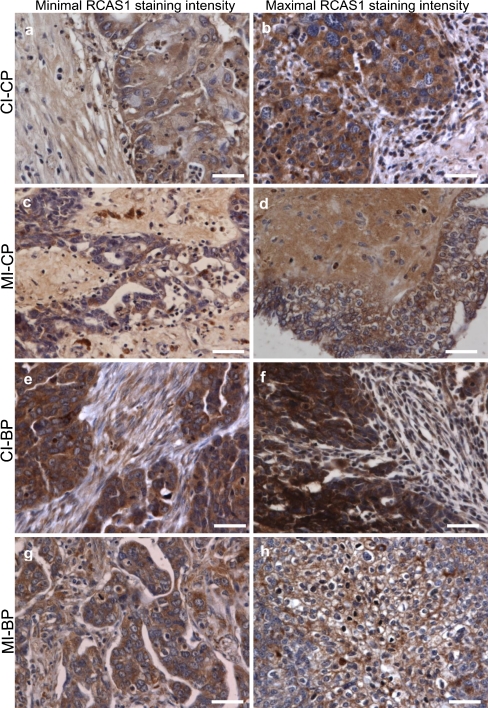
Fig. 2.
RCAS1 immunoreactivity within the ovarian cancer nest. Scale bars = 50 μm. a) Cytoplasmatic RCAS1 immunoreactivity (CI) within the ovarian cancer cells derived from the central part of the tumor (CP) with predominant minimal staining expression 1+. b) Cytoplasmatic RCAS1 immunoreactivity (CI) within the ovarian cancer cells derived from the central part of the tumor (CP) with predominant maximal staining expression 2+. c) Membrane RCAS1 immunoreactivity (MI) within the ovarian cancer cells derived from the central part of the tumor (CP) with predominant minimal staining expression 0. d) Membrane RCAS1 immunoreactivity (MI) within the ovarian cancer cells derived from the central part of the tumor (CP) with predominant maximal staining expression 1+. e) Cytoplasmatic RCAS1 immunoreactivity (CI) within the ovarian cancer cells derived from the border part of the tumor (BP) with predominant minimal staining expression 2+. f) Cytoplasmatic RCAS1 immunoreactivity (CI) within the ovarian cancer cells derived from the border part of the tumor (BP) with predominant maximal staining expression 3+. g) Membrane RCAS1 immunoreactivity (MI) within the ovarian cancer cells derived from the border part of the tumor (BP) with predominant minimal staining expression 0. h) Membrane RCAS1 immunoreactivity (MI) within the ovarian cancer cells derived from the border part of the tumor (BP) with predominant maximal staining expression 2+

