
Figure 3.
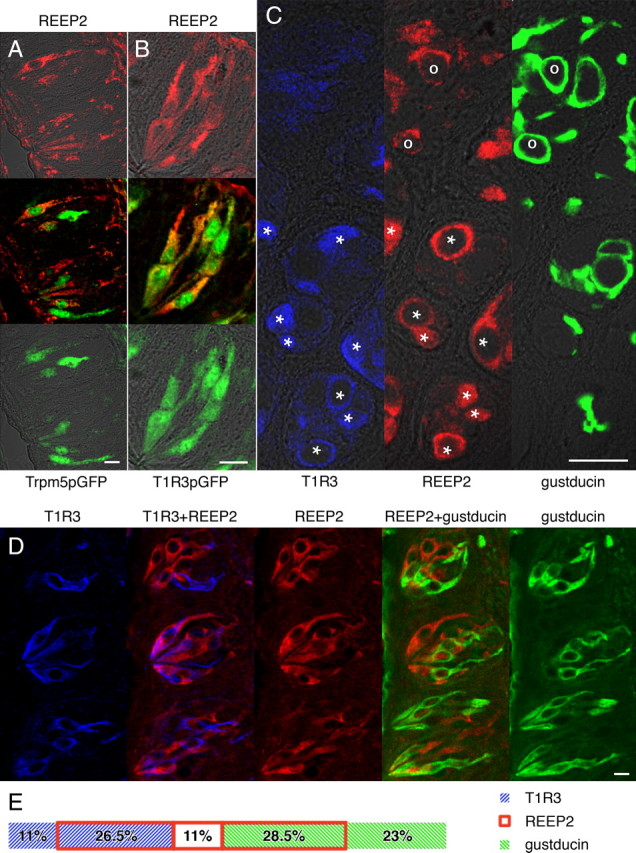
Coexpression of REEP2 with taste signaling elements in taste cells. Confocal microscopy was used to detect REEP2 and taste-specific signaling molecules in taste cells from circumvallate papillae. A, B, Coexpression of REEP2 (red, top panels) with Trpm5 and T1R3 (green, bottom panels), as seen by double immunofluorescence staining using rabbit anti-REEP2 and goat anti-GFP antibodies with taste cells derived from transgenic mice expressing GFP under the Trpm5 promoter (A, Trpm5pGFP) or the T1R3 promoter (B, T1R3pGFP). Top and bottom panels are confocal overlays of fluorescent and transmission channels, middle panels are overlays of red and green fluorescent channels. C, D, Coexpression of REEP2 with T1R3, and of REEP2 with gustducin, as seen by single immunofluorescence staining of three serial transverse (C), or three serial longitudinal (D) sections. Rabbit anti-gustducin labeling is shown in green, rabbit anti-REEP2 in red and rabbit anti-T1R3 in blue. In C, Cells coexpressing gustducin and REEP2 are marked by “o”, cells coexpressing T1R3 and REEP2 are marked by *. Double images in D are overlays of green/red images (REEP2+gustducin) or red/blue images (T1R3+REEP2). E, Expression distribution in taste cells from circumvallate papillae, shown as a percentage of the total number of cells labeled by immunofluorescence (n = 159). Section thicknesses were 5 μm (A, B, D) or 4 μm (C). Scale bars, 20 μm.