Figure 6.
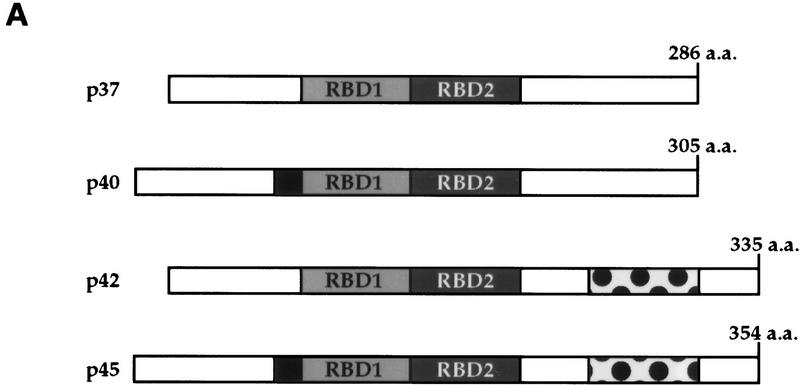
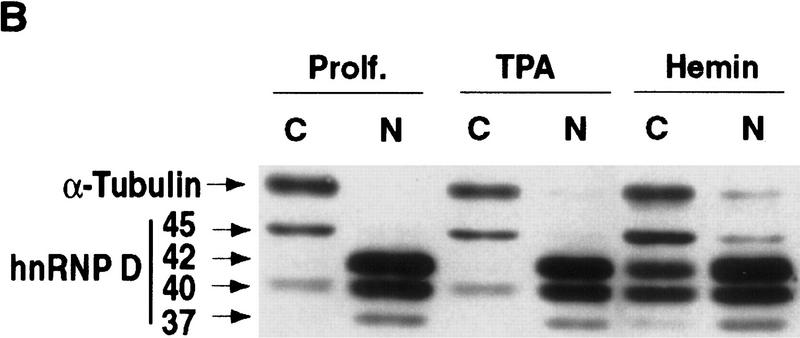
Hemin induces changes of the subcellular localization of hnRNP D isoforms. (A) Schematic diagram of the four hnRNP D isoforms. The two RNA-binding domains (RBD1 and RBD2) are depicted as the central two gray-shaded regions. The four proteins are identical except for a 19-amino-acid exon present at the amino terminus of p40 and p45 (denoted by the filled square region) and a carboxy-terminal 49-amino-acid region present in p42 and p45 (represented by the dotted region). (B) Cytoplasmic (C) and nuclear (N) proteins of K562 III-2 cells from either proliferation cells (Prolf), cells treated with 20 nm TPA for 24 hr (TPA), or cells treated with 50 μm hemin for 24 hr (Hemin) were separated on a 12% SDS–polyacrylamide gel and transferred to nitrocellulose membranes for Western blot analysis. The blots were probed with a monoclonal antibody (5B9) for endogenous hnRNP D and a monoclonal antibody for α-tubulin simultaneously followed by chemilumenescent detection with an anti-mouse IgG antibody. Molecular weights of the four hnRNP D isoforms as well as α-tubulin are indicated. (C) The time frame for hemin-induced changes of localization of hnRNP D isoforms was analyzed with lysates from K562 III-2 cells treated with 50 μm Hemin for the various time intervals indicated. Equal amounts of cytoplasmic and nuclear protein were used for all experiments.


