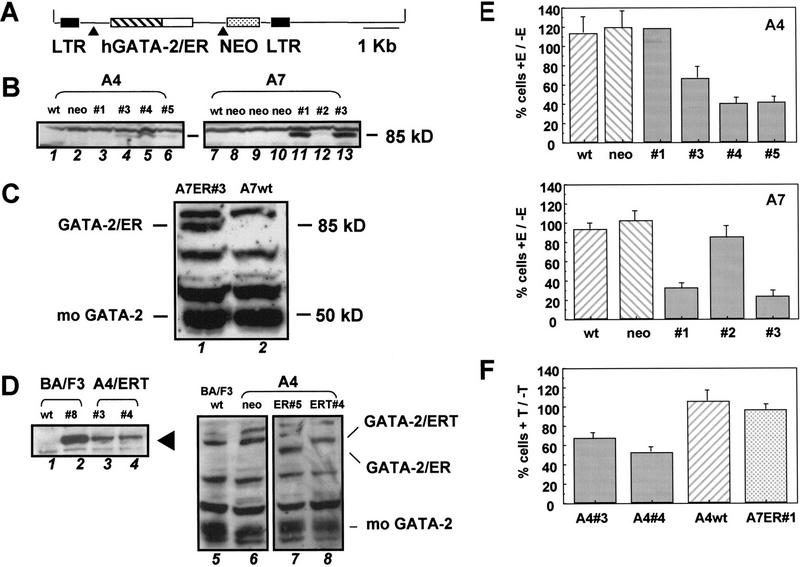
Figure 1.
Forced expression of GATA-2 in murine FDCP-mix cells. (A) Retroviral construct used for infection of hematopoietic cells. The GATA-2/ER fusion (see Materials and Methods) was transferred into the MESV-based retroviral vector p50-M-X-neo. Expression of both GATA-2/ER and the neo selectable marker is under the control of the viral LTR and achieved through alternative splicing of the viral mRNA (▴). A similar p50-M-X-neo construct containing a Flag epitope-tagged GATA-2/ERT fusion was also prepared (not shown). (B) Clones of FDCP-mix A4 (left) and FDCP-mix A7 (right) successfully infected and expressing the 85-kD GATA-2/ER protein were identified by Western blotting using an anti-GATA-2 antibody. (Left) (Lane 1) Wild-type FDCP-mix A4; (lane 2) vector-alone infected control cells; (lanes 3–6) GATA-2/ER infected clones 1, 3, 4, and 5. (Right) (Lane 7) Wild-type FDCP-mix A7; (lanes 8–10) vector-alone infected control cells; (lanes 11–13) GATA-2/ER-infected clones 1, 2, and 3. (C) The level of GATA-2/ER protein in FDCP-mix A7 relative to endogenous mouse GATA-2 was determined by Western blotting using an anti-GATA-2 polyclonal antibody which recognizes both human and mouse GATA-2. (Lane 1) A7 GATA-2/ER no. 3; (lane 2) wild-type FDCP-mix A7 cells. (D) Analysis of FDCP-mix GATA-2/ERT clones. (Left) Clones expressing the Flag-tagged GATA-2/ERT protein (arrowhead) were identified using the M2 anti-Flag antibody. (Lane 1) Wild-type BA/F3; (lane 2) BA/F3 GATA-2/ERT clone 8b (positive control); (lanes 3,4) FDCP-mix A4 clones 3 and 4 expressing GATA-2/ERT. (Right) The level of GATA-2/ERT protein in the FDCP-mix A4 GATA-2/ERT clones relative to endogenous mouse GATA-2 and to GATA-2/ER in the highest expressing clone was determined by Western blot using the anti-GATA-2 antibody that recognizes all three proteins. (Lane 5) BA/F3 (negative control); (lane 6) FDCP-mix A4 neo (negtive control); (lane 7) FDCP-mix A4 GATA-2/ER clone 5; (lane 8) FDCP-mix A4 GATA-2/ERT clone 4. The GATA-2/ER, GATA-2/ERT, and endogenous mouse GATA-2 bands are indicated. (E) Inhibition of cell growth of FDCP-mix A4 GATA-2/ER (top) and FDCP-mix A7 GATA-2/ER (bottom) clones. A4wt cells are wild-type FDCP-mix A4 cells, whereas A4neo are vector-alone infected FDCP-mix A4 cells. A4 no. 1, A4 no. 3, A4 no. 4, and A4 no. 5 are the GATA-2/ER clones shown in B (left). A7wt cells are wild-type FDCP-mix A7 cells; A7neo are vector-alone infected cells; and A7 no. 1, A7 no. 2, and A7 no. 3 are the GATA-2/ER clones shown in B (right). In these and all subsequent experiments we observed no significant differences between wild-type and vector-alone infected cells. Cells were seeded at 8 × 10⁴/ml in IL-3-containing medium and in the presence or absence of 2μm β-estradiol. After 3 days of growth at 37°C, the cells were harvested and counted after trypan blue staining. The number of cells obtained in the presence of β-estradiol (+E) is expressed as a percentage of that in the absence of β-estradiol (−E). The results are the average of at least three experiments ±s.e.m., except for A4 no. 1, which was only assayed once. (F) Inhibition of cell growth of GATA-2/ERT-expressing clones. Cells were seeded at 8 × 10⁴/ml in IL-3-containing medium and in the presence or absence of 2μm tamoxifen. After 3 days of growth at 37°C, the cells were harvested and counted after trypan blue staining. The number of cells obtained in the presence of tamoxifen (+T) is expressed as a percentage of the number in the absence of tamoxifen (−T). The results are the average of three experiments ±s.e.m..

