Figure 7.
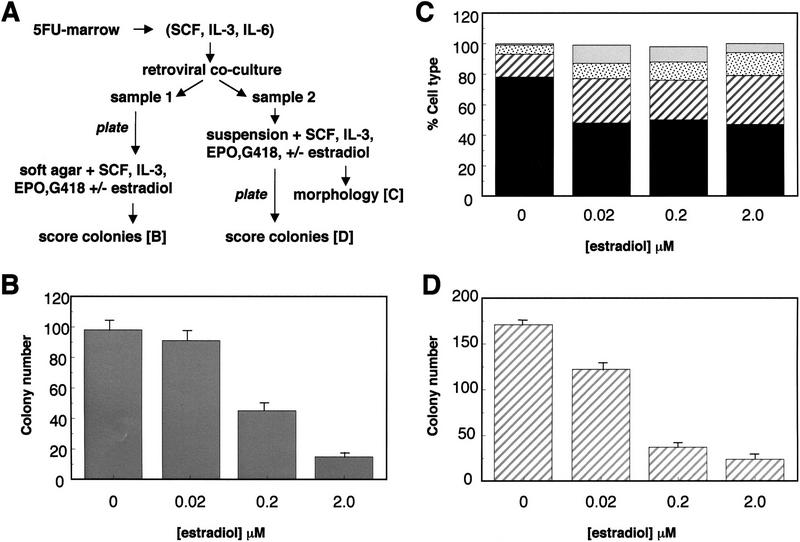
Enforced expression of GATA-2/ER in primary 5-FU bone marrow cells. (A) Scheme for the infection and assay of the effect of GATA-2/ER-expression in 5-FU bone marrow. (B) After retroviral infection, sample 1 was plated into soft agar assays in the presence of various doses of β-estradiol, growth factors, and G418. The results show the number of colonies at day 8 per 105 cells plated and are the average of triplicate plates. The error bars represent the s.d.. These results are representative of three similar experiments. (C) After 3 days in suspension culture, the cells from sample 2 were harvested and the morphology of the cells determined as described previously. The nested bar charts represent the numbers of different cell types: blasts (solid black), early granulocytes (hatched stripes), late granulocytes (stippled), and monocytes (shaded) seen at various β-estradiol concentrations and expressed as a percentage of the total cell number. (D) After 3 days in suspension culture, an aliquot of each well (1/33)/ml was plated in soft agar assay to determine the colony-forming potential of the cells. The number of colonies per plate is shown and is the average of triplicate plates, the error bars representing s.d.. These results are representative of two similar experiments.

