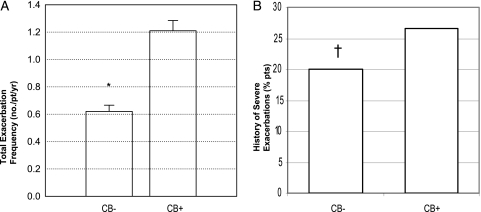
Figure 2.
Exacerbation rate in each group. A, Total exacerbation rate. B, History of severe exacerbations. Both total exacerbation rate (data are presented as mean ± SE) and history of severe exacerbations were significantly greater in the CB+ group than in the CB− group. *P < .0001. †P = .0238. pt = patient. See Figure 1 legend for expansion of other abbreviation.

