
Figure 4. The PD1.3 mAb blocks the PD-1 binding to both PD-L1 and PD-L2 and enhances T cell activation.
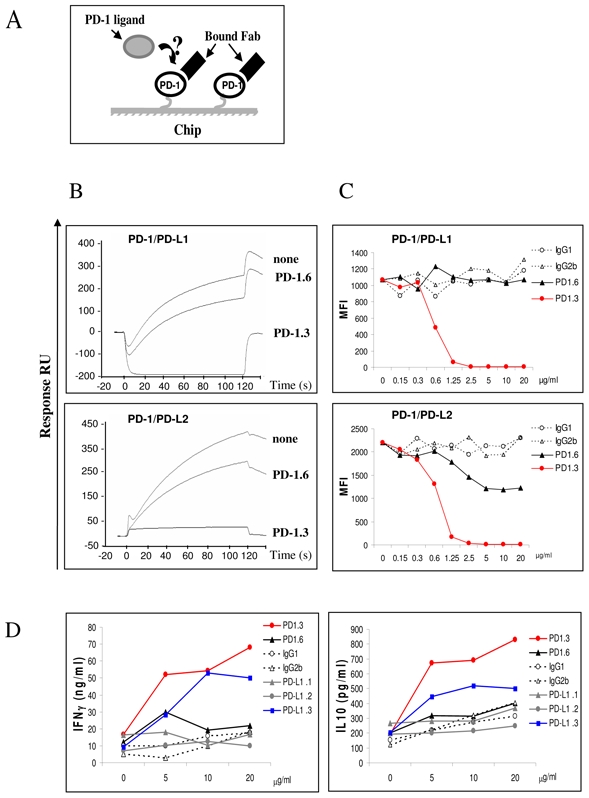
(A) A schematic representation of the surface competitive binding inhibition used in (B). In a first step the immobilized PD-1 proteins are saturated using the antibody Fabs and the corresponding PD-1 ligands are injected as a soluble analyte in a second step.
(B) PD-L1-Ig (top row) and PD-L2-Ig (lower row) were injected at 10 μg/ml for two minutes at a flow rate of 10μl/min onto PD-1 chip (none), or PD-1 chip pre-incubated with anti PD-1 Fab, PD-1.3 or PD-1.6. Sensorgrams showing the binding of the PD-1 ligands in the different situations are superimposed. The data shown are representative of three separate experiments.
(C) PD-1. 3 mAb prevents PD-L1-Ig and PD-L2-Ig binding to cells expressing PD-1. Flow cytometry analysis on PD-1 expressing COS cells. PD-1.3, PD-1.6 or isotype control mAbs, at increasing concentration (from 0 to 20 μg/ml) were pre-incubated with PD-L1 or PD-L2-Ig proteins. The binding of ligands proteins were revealed with goat anti human (GAH) conjugated with PE, the MFI was indicated in the Y axis. The data shown are representative of three separate experiments.
(D) PD-1.3 and PD-L1.3 mAbs are able to induce the IFN-γ and IL-10 production in CD4+ T cells upon DC cell contacts. Allogenic iDC were cocultured with CD4+ T cells with increasing concentration of PD-1 and PD-L1 mAbs or isotype control (from 0 to 20 μg/ml). Cultures were incubated for 5 days, supernatants were removed for cytokine analysis. The levels of IFN-γ production and IL-10 production were determined in duplicate by ELISA detection. The data shown are representative of two separate experiments.