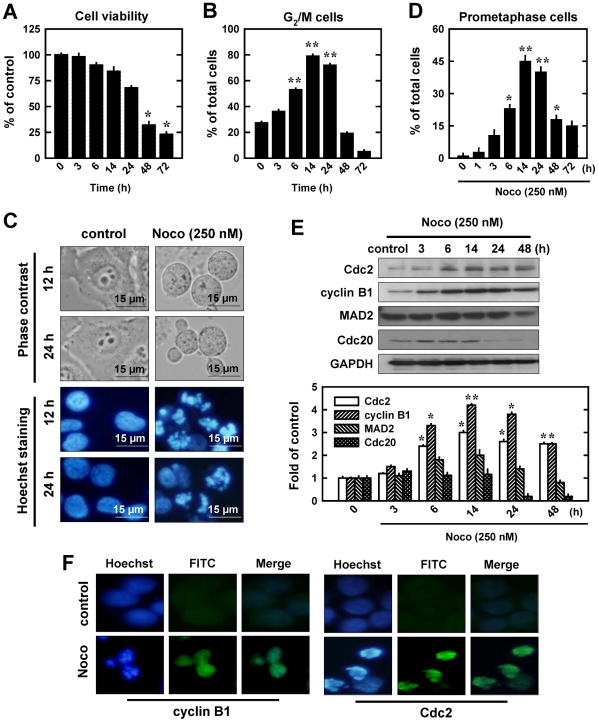
Figure 1. Induction of cell cycle arrest and cyclin B1/Cdc2 activation in MCF-7 cells by nocodazole (Noco).
A. Changes in cell viability (MTT assay) after treatment of cells with 250 nM nocodazole for different lengths of time. Each data point is the mean ± S.D. from four replicate measurements from one representative experiment. B. Time-dependent induction of G2/M cell cycle arrest following treatment with nocodazole. Cells were seeded at 5×10⁴ cells/mL and then treated with 250 nM nocodazole for 3, 6, 14, 24, 48 and 72 h. Cells were harvested and analyzed using flow cytometry. C. Cells were treatment with 250 nM nocodazole for 12 or 24 h, stained with Hoechst-33342, and examined in a phase contrast (PC) microscope (upper panel) or a fluorescence microscopy (lower panel) (at ×200 magnification). As shown, many cells are arrested in mitosis (prometaphase) after 250 nM treatment. D. Cells were treated with 250 nM nocodazole for 3, 6, 14, 24, 48 and 72 h. The morphology of cells arrested in prometaphase (based on 200 or more nuclei in each sample) was scored by fluorescence microscopy. Each bar is the mean ± S.D. value from three separate experiments. * P<0.05, ** P<0.01 versus vehicle-treated control. E (upper part). Time-dependent changes in cyclin B1 and Cdc2 protein levels following nocodazole treatment. Cells were treated with nocodazole (250 nM) for the length of time as indicated, and whole cell lysates were prepared. An equal amount of protein lysates was electrophoretically separated on the 10% SDS-polyacrylamide gel, and transferred to nitrocellulose membrane. Western blots were detected using specific antibodies against cyclin B1, Cdc2 (CDK1), MAD2, and Cdc20 on an enhanced chemiluminescence (ECL) apparatus. Membrane was stripped for determining the levels of GAPDH as a loading control. E (lower part). The relative protein levels for cyclin B1, Cdc2, MAD2, and Cdc20 were calculated according to their densitometry readings, which were normalized according to the corresponding readings for the GAPDH protein bands. Each value is mean ± S.D. from three replicate determinations. * P<0.05, ** P<0.01 versus vehicle-treated control. F. Cells were treatment with 250 nM nocodazole for 12 h and analyzed using immunofluorescence staining for cyclin B1 and Cdc2. Representative photographs were taken under a fluorescence microscope (original magnification, ×200).

