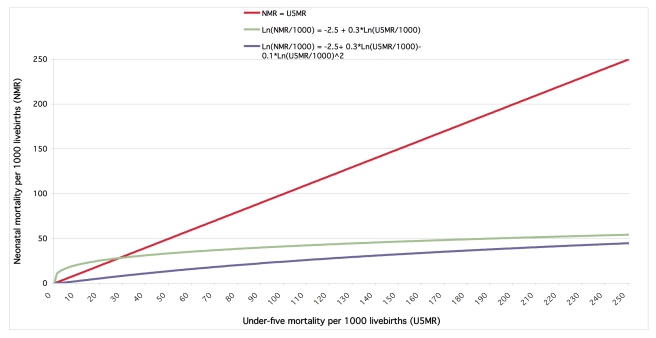
Figure 4. Modeled relationship between U5MR and NMR.
The blue curve illustrates our fitted statistical model predicting NMR for method 2 countries (see Methods). The curve was drawn with country and regional random effects assumed zero to show the assumed functional relationship between U5MR and NMR—in practice, within our multilevel statistical model, these random effects vary by country and region, respectively, such that the precise functional relationship between NMR and U5MR differs between countries. The green curve is similar to the blue model without allowing for a nonlinear association on the log scale. Compared to the green curve, the blue curve allows for more plausible changes in NMR at lower levels of U5MR; particularly, the green curve implies impossible NMRs at small U5MRs for countries and regions with positive random effects, as NMR would exceed U5MR. For comparison, the red line illustrates a linear relationship on the normal scale, NMR = U5MR, which is highly improbable, as it would allow for the same change in NMR for a given change in U5MR at all levels of U5MR.

