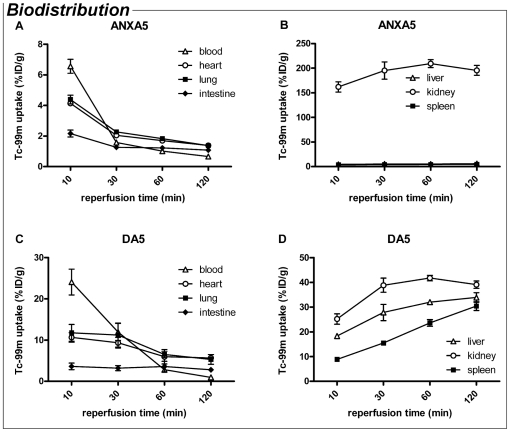
Figure 5. Biodistribution of Annexin A5 (ANXA5) and Diannexin (DA5) after i.v. injection, over a time course of 2 h.
Uptake of 99mTc in vital organs is presented as % of the injected dose (ID) per gram. (A) Plasma levels of ANXA5 declined steeply 10 to 30 min after injection. (B) Accumulation was most pronounced and rapid in the kidney, while low levels of ANXA5 were found in liver and spleen. (C) DA5 blood levels at t = 10 min were over 3 times higher than of ANXA5 and declined until 1 h after injection. (D) Accumulation of the probe was detected in kidney, liver and spleen. Values are means ± SEM. n = 3 mice per treatment.

