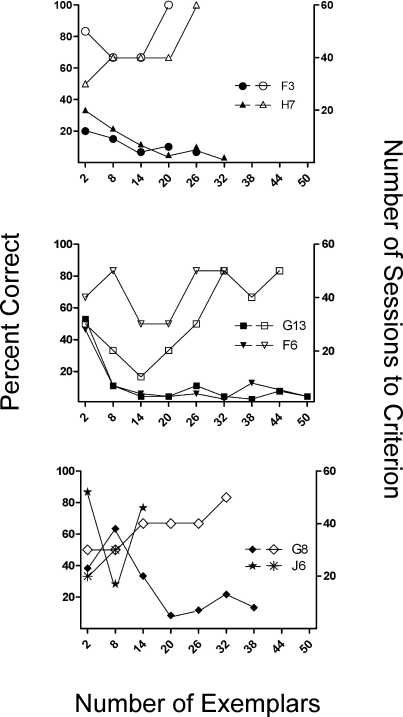
Fig 7.
Percent correct on novel-sample trials (open symbols, left vertical axis) and number of sessions to criterion (closed symbols, right vertical axis) are plotted as a function of the number of exemplars as training progressed in Experiment 2. The top panel shows subjects with approximately 40 total sessions (F3 and H7), the middle panel shows the same function for subjects with approximately 60 total sessions (G13 and F6), and the lower panel for subjects with approximately 100 total sessions (G8 and J6).

