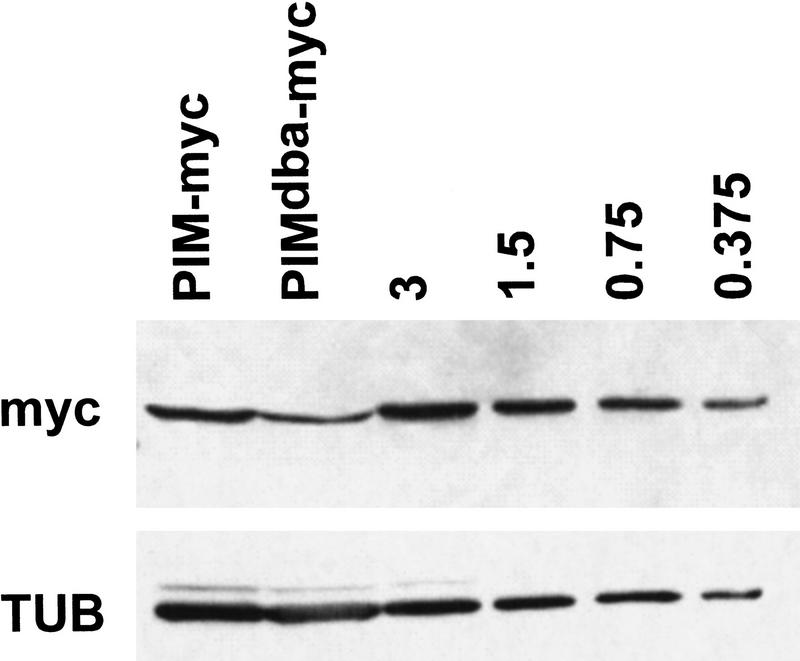
Figure 6.
Analysis of PIMdba–myc expression levels. Extracts from embryos with either the gpim–myc (PIM–myc) or the gpimdba–myc (PIMdba–myc) transgene were analyzed by immunoblotting with antibodies against the myc epitope (myc) or tubulin (TUB), which served as a loading control. In addition, to allow quantitative comparisons, we also analyzed an extract from embryos with a 3× higher gpim–myc transgene dose (3) as well as twofold serial dilutions of this extract (1.5; 0.75; 0.375).

