FIGURE 3.
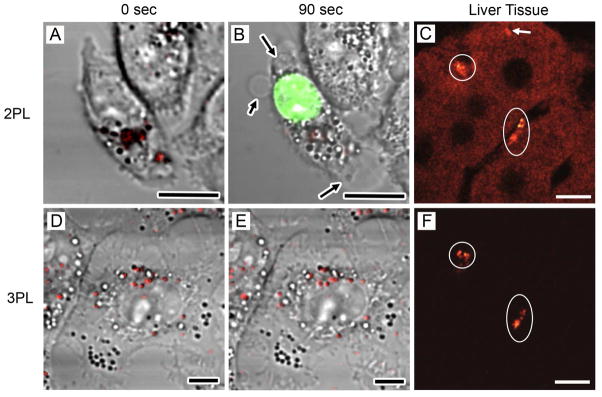
Comparison of 2PL and 3PL imaging of AuNCs in KB cells and liver tissues. (A) 2PL image and (D) 3PL image of AuNCs (red) in KB cells before laser scanning. (B) Image of the same cell as in (A) after scanning with 760 nm femtosecond laser for 90 s. Membrane blebbing (black arrows) and compromised membrane integrity were revealed by ethidium bromide labeling (green). (E) 3PL image of the same cell as in (D) after scanning with a 1290 nm femtosecond laser for 90 s. No morphological change or plasma membrane damage was observed. (C) 2PL imaging of AuNCs (white circles) in liver tissue. (F) 3PL imaging in the same area as in (C). White arrow: Anomalously strong autofluorescence from tissue. Scale bars: 10 mm.24

