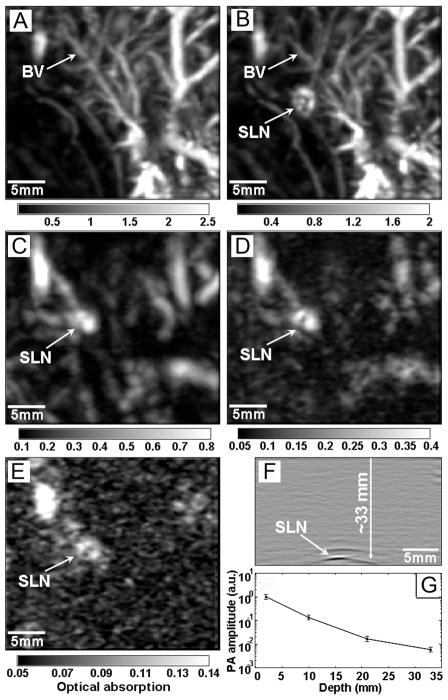
FIGURE 4.
Depth capability of SLN mapping with AuNCs. PA images taken (A) before and (B-E) after the injection of AuNCs for: (B) 28 min; (C) 126 min with a layer of chicken breast tissue placed on axillary region (imaging depth: 10 mm); (D) 165 min with the second layer of chicken breast tissue (imaging depth: 21 mm); (E) 226 min with the third layer of chicken breast tissue (imaging depth: 33 mm). (F) PA B-scan with 20 times signal averaging, showing the SLN located 33 mm deep. (G) The amplitude variations of PA signals over imaging depths. BV: blood vessel.21

