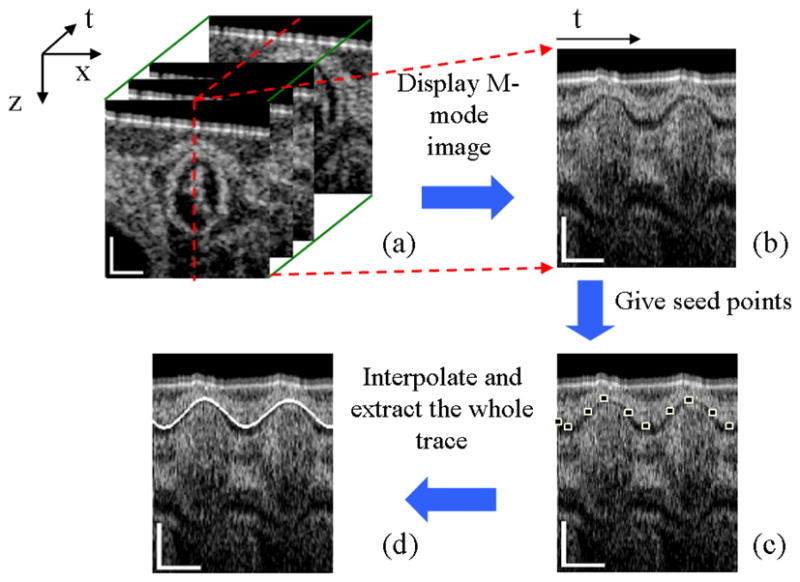
Fig. 2.

Flow chart of myocardial border extraction: Extract M-mode image (b) from M-B scan dataset (a) at the selected red line; Give several seed points as shown in (c); Interpolate between these points and give the whole trace (d). The scale bars in (a) and the vertical scale bars in (b) (c) and (d) represent 200μm; the lateral scale bars in (b) (c) and (d) represent 0.2s.
