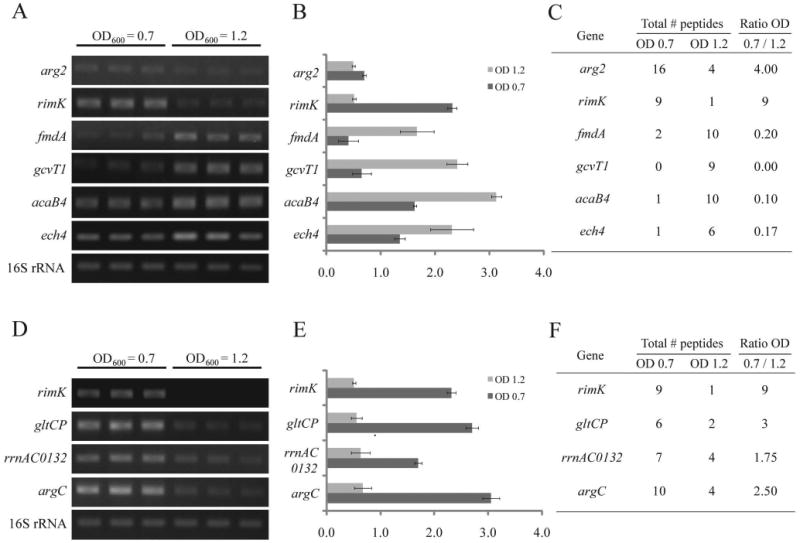
Figure 2. Validation of the differential expressed protein candidates predicted by spectral count.

RT-PCR results of six “primary candidate” genes that had 3-folds or more changes in peptide ratio (A) and the primary candidate rimK and its “extended candidates” in lysine biosynthesis pathway that had the same trend of changes in spectral counts (D). The 16S rRNA is served as the internal control. Expression level in (A) and (D) normalized against the 16S rRNA signals are shown in (B) and (E), respectively. The spectral counts of the tested genes are shown in (C) and (F).
