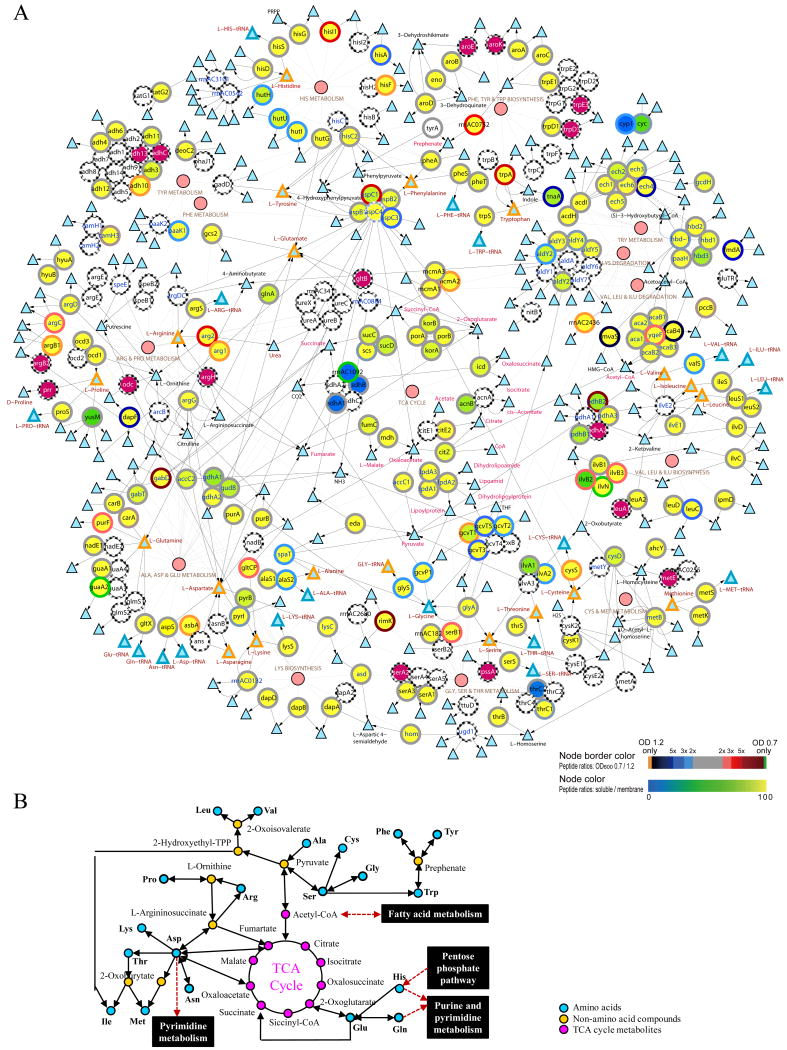
Figure 3. Integrative view of amino acid metabolisms and TCA cycle.
Complete network: Large circles represent the enzymes and small circles denote the pathways (A). Triangles with orange, blue, black colored perimeters indicate the amino acids, aminoacyl-tRNA, and metabolic intermediates, respectively. Color scales shown on the bottom right corner indicate the log2 ratio of the number of peptides identified in OD600 0.7 and 1.2 (perimeters of the circles; top color scale) and the percentage of peptides identified in the soluble fraction (color of the circles; bottom color scale). Large purple circles represent proteins with single unique peptide identification. The arrows represent the direction of enzymatic reactions (double arrows denote reversible reactions) and thin lines link the enzymes to their corresponding pathways. The metabolic pathways information was derived from the KEGG database and the network was displayed using the Cytoscape software. A simplified network of amino acid metabolisms and TCA cycle is shown in (B).

