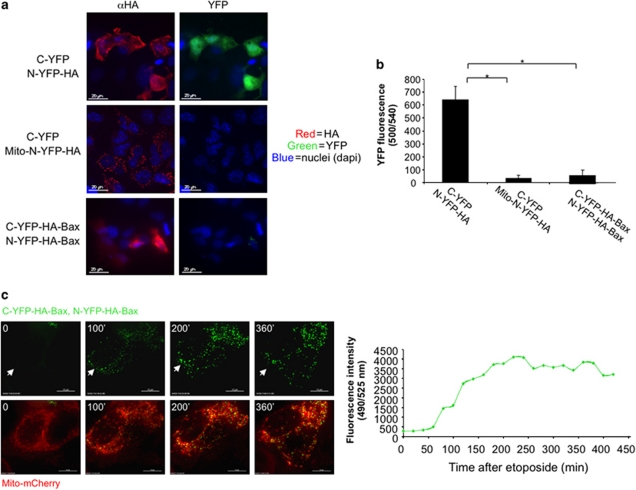
Figure 1.
N-YFP–HA–Bax and C-YFP–HA–Bax generate a YFP signal in cells treated with etoposide. (a) MCF-7 cells were transiently transfected with either C-YFP and N-YFP–HA (top panel), C-YFP and Mito–N-YFP–HA (middle panel), or C-YFP–HA–Bax and N-YFP–HA–Bax (bottom panel). IF staining using anti-HA antibody was used to correlate the subcellular localization of the YFP fragments (red) with the YFP signal (green). (b) The bar graph depicts the difference in the YFP signal observed in panel a, measured using a fluorescent plate reader; n=3, *P<0.005. (c) MCF-7 cells were transiently transfected with N-YFP–HA–Bax, C-YFP–HA–Bax and mitochondrial mCherry. After 24 h, the cells were treated with 100 μM etoposide and followed using a DeltaVision microscope. 100 min after the addition of the death signal, a strong YFP fluorescence was detected (left panel). Right panel: YFP fluorescence intensity was measured for the cells in panel c using the SoftWoRx software (Applied Precision, Issaquah, WA, USA)

