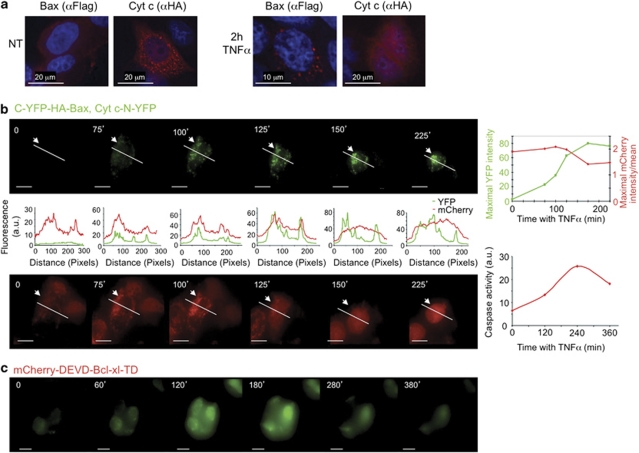
Figure 3.
C-YFP–HA–Bax and Cyt c–N-YFP generate a specific YFP signal that correlates with caspase activation in cells treated with TNFα. (a) MCF-7 cells were transiently transfected with C-YFP–Flag–BAX and Cyt c–N-YFP–HA. IF staining using anti-Flag and anti-HA antibodies, with or without TNFα (10 ng/ml) and actinomycin-D (2 μg/ml) treatment, shows the sub-cellular distribution of the proteins. (b) MCF-7 cells expressing C-YFP–HA–Bax, Cyt c–N-YFP and an mCherry caspase sensor were treated with TNFα and ActD, and imaged using a DeltaVision time-lapse microscope. The YFP signal increases at the mitochondria 75 min after the addition of TNFα (top left panel; bar, 10 μm). Fluorescence of mCherry is shown in the bottom panel (bar, 10 μm). YFP and mCherry fluorescence intensities along the marked line were measured using the ImageJ software (middle panel). Maximal YFP fluorescence relative to maximal mCherry fluorescence divided by the mean is plotted on the graph (top right panel). The induction of YFP signal was followed by the translocation of mCherry to the cytoplasm and correlated with caspase activity (low right panel). (c) MCF-7 cells expressing C-YFP–HA–Bax and Cyt c–N-YFP were treated with 30 μM menadione and imaged using a DeltaVision time-lapse microscope (bar, 10 μm)

