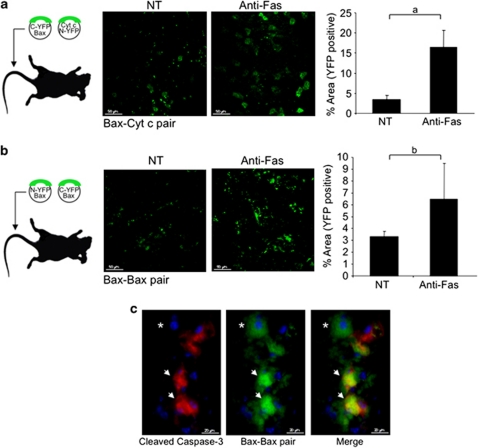
Figure 4.
In vivo complementation of Bax–Bax and Bax–Cyt c YFP in liver. FVB mice were i.v. injected with 30 μg of a mixture of N-YFP–HA–Bax and C-YFP–HA–Bax (a) or C-YFP–HA–Bax and Cyt c–N-YFP (b). Twenty-four hours later the mice were left untreated (n=2) or injected with a single i.p. dose of 0.55 μg/g anti-Fas antibody (n=4). Four hours after anti-Fas antibody injection mice were killed and livers were immediately imaged, ex vivo, using a two-photon microscope, using the YFP channel (850 nm). The percentage of YFP-positive area was measured using the ImageJ software (right panel); aP<0.005; bP<0.05. (c) Histological floating sections of liver prepared from mice hydrodynamicaly injected with N-YFP–HA–Bax and C-YFP–HA–Bax were stained using an anti-cleaved/active caspase-3 antibody (red) and correlated with the YFP signal (green, arrows). *Indicates YFP-positive cells with no red staining, indicating Bax activation before caspase activation

