Figure 6.
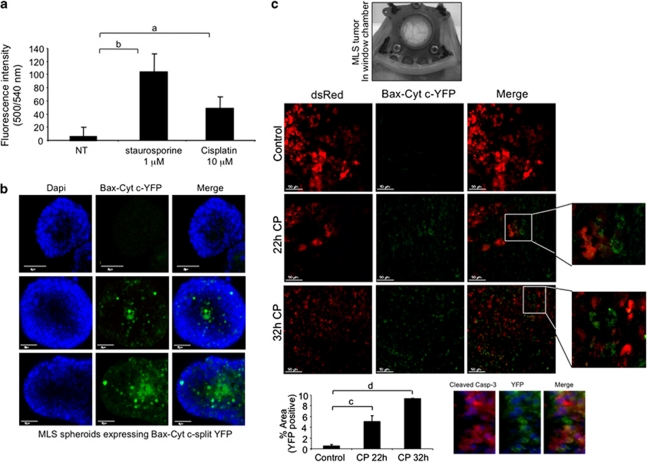
Bax–Cyt c YFP complementation as a tool to detect tumor cell apoptosis. (a) MLS cells stably expressing Cyt c–N-YFP and C-YFP–Bax were seeded in a black, 96-well plate. Twenty-four hours later the cells were either left untreated (NT), or treated with 1 μM staurosporine or 10 μM cisplatin. YFP fluorescence was measured using a Synergy2 plate reader, using a YFP-specific filter set. aP<0.05; bP<0.0001. (b) MLS cells stably expressing Cyt c–N-YFP and C-YFP–HA–Bax were grown in a spinner flask for 10 days, fixed in 2.5% PFA and immersed in DAPI solution. The spheroids were imaged by confocal microscopy. (c) A mixture of MLS cells stably expressing either Cyt c–N-YFP and C-YFP–HA–Bax (2.7 × 10⁶), or DsRed (1.3 × 10⁶), was injected intra-dermally into the center of a dorsal skinfold window chamber created in 8-week-old female CD-1 nude mice. Ten days later cisplatin was injected (12 mg/kg) and live-cell imaging was performed using a confocal microscope. The percentage of YFP-positive area was measured using the ImageJ software (bottom graph). cP<0.002; dP<0.0001. Tumors were removed and histological floating sections were stained using an anti-cleaved/active caspase-3 antibody (red), and correlated with the YFP signal (green)

