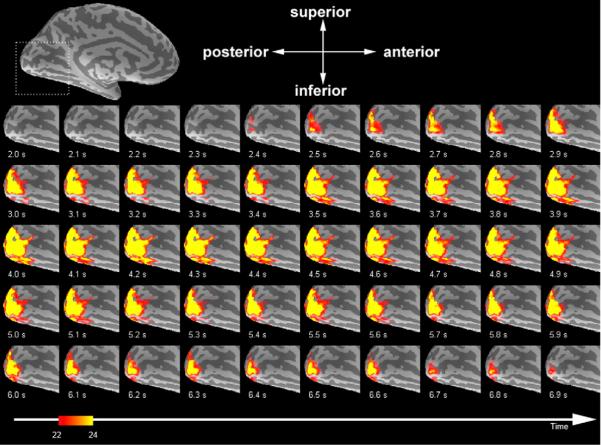
Fig. 8.
Group average task-related activity. (Top) An inflated left hemisphere cerebral cortex with anatomical orientation (A: anterior; P: posterior; S: superior; I: inferior). Light and dark gray represent gyri and sulci. The calcarine sulcus is labeled. The dashed box indicates the border of the InI LCMV-dSPM single frame time series. (Bottom) Single frames of the InI LCMV-dSPM t-values in visual cortex averaged across five participants shown from the medial aspect of the left hemisphere using an inflated brain surface model. The critical threshold was t>8 (uncorrected p-value<10−4).

