
Figure 5. Expression of IRE-regulated proteins in the SN.
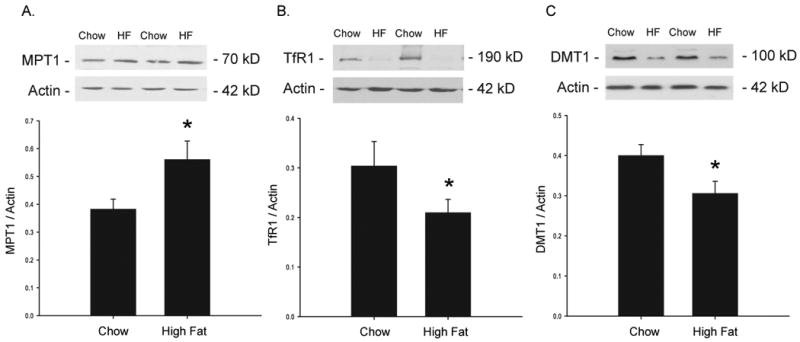
Expression of proteins involved in iron transport was also affected in the SN. Ferroportin was significantly increased (A), while TFR1 (B) and DMT1 (C) were significantly decreased, suggesting increased intracellular iron content. Values are means ± SE for 11-15 rats per group. *p<0.05 chow vs. HF.