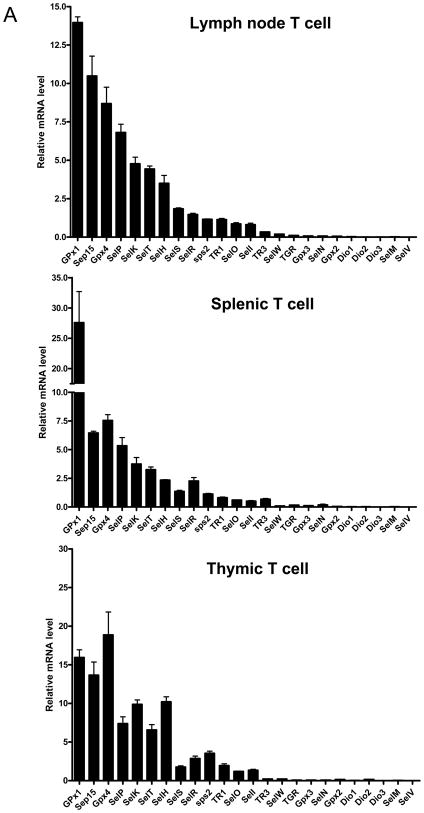
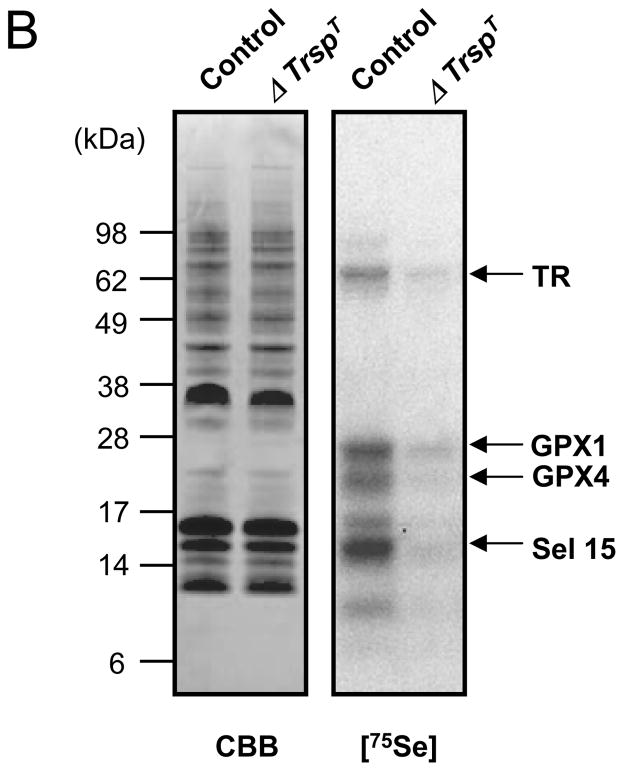
Fig. 2. Selenoprotein expression in T cells.
In (A), expression of selenoprotein mRNA was assessed by quantitative real-time PCR. Purified T cells were obtained from lymph nodes, spleen and thymus of mice as described(21). In (B), expression of selenoproteins was assessed by 75Se-labeling as described(27). The identities of major, labeled selenoproteins are designated on the right panel; and the left panel shows Coomassie-Blue stained gel which was used as a loading control.


