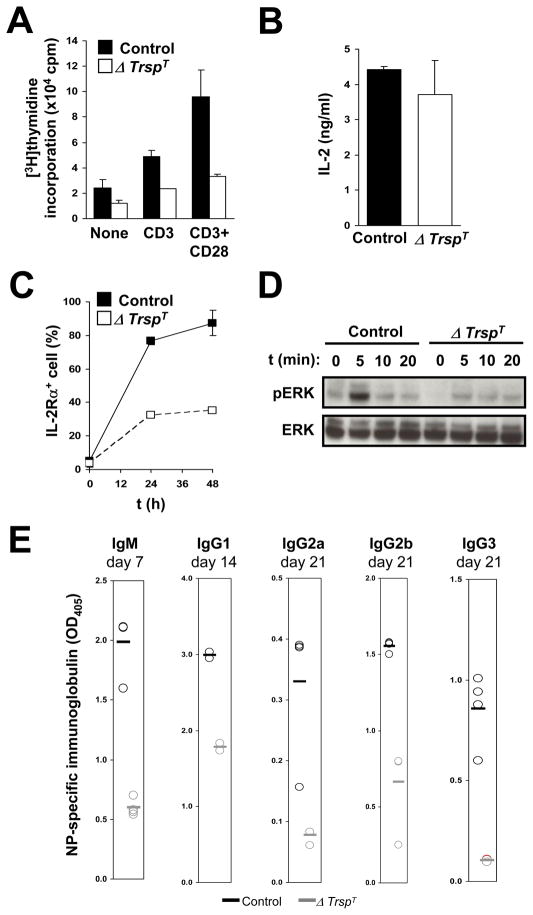
Fig. 3. Activation of control and selenoprotein-deficient cells by TCR stimulation.
T cells were isolated from lymph nodes of control and ΔTrspT mice. In (A), the level of proliferation was assessed by incorporation of [3H]-thymidine in absence or presence of anti-CD3/CD28 or anti-CD3 alone. The results of the averages of triplicate determinations from six control and ΔTrspT mice, respectively, are shown. In (B and C), the levels of IL-2 production (B) and cell surface expression of IL-2Rα (C) in CD3/CD28-stimulated T cells are shown. In (D), Erk activation in T cells stimulated with anti-CD3 and anti-CD28 was analyzed at the time intervals indicated. Both phosphorylated (pERK) and total (ERK) proteins are shown. In (E), serum levels of major Igs at indicated time points were determined by ELISA in control and ΔTrspT mice following immunization with NP-OVA. Circles represent Ig levels of each animal. Bars represent the mean values. Experimental details are given in Shrimali et al.(21)

