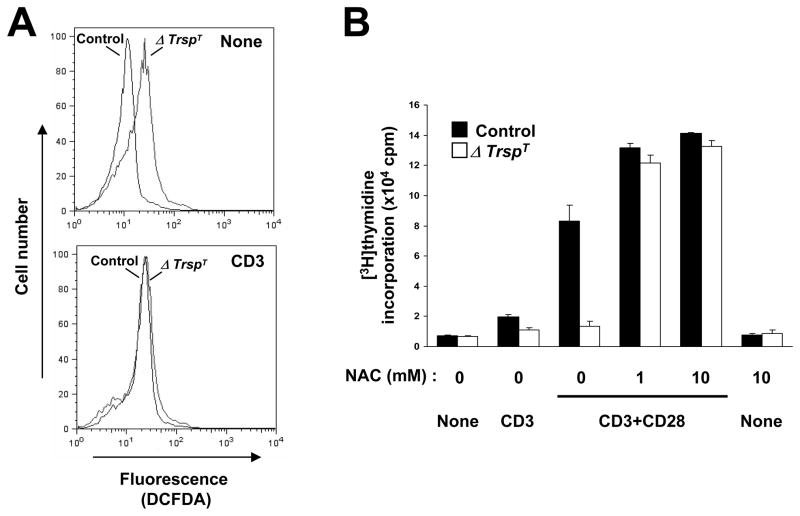
Fig. 4. ROS production in TCR-stimulated T cells.
In (A), control and ΔTrspT T cells isolated and purified from lymph nodes and either unstimulated or stimulated with anti-CD3 antibody were used. ROS production was analyzed in by flow cytometry using DCFDA. In (B), control and ΔTrspT T cells were either unstimulated (None) or stimulated as indicated in the presence of various concentrations of NAC. T cell proliferation and all other determinations used in the figure are described in Shrimali et al.(21)

