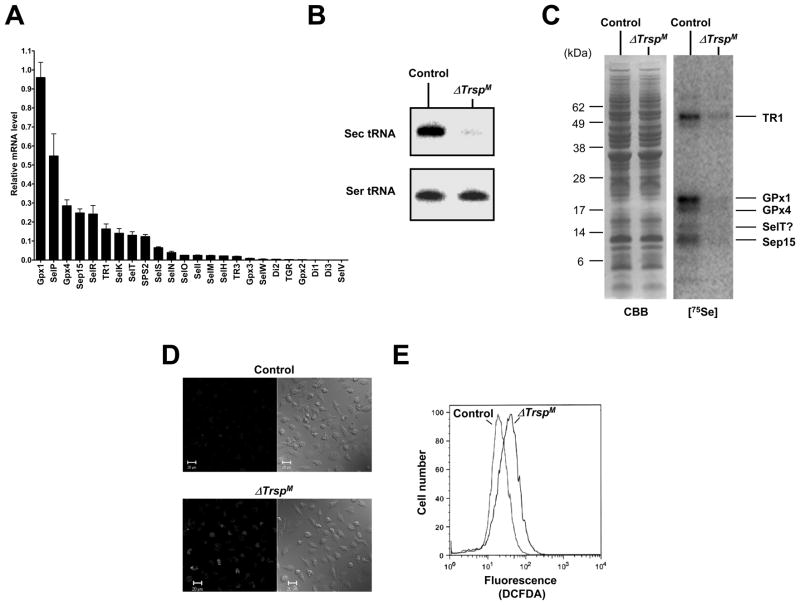
Fig. 5. Selenoprotein gene expression in macrophages.
In (A), selenoprotein gene expression in macrophages was analyzed by real-time PCR and is shown as the relative mRNA level to that of Gusb which was used as the internal control. In (B), northern blot analysis showing levels of Sec tRNA in control and ΔTrsp macrophage. In (C), 75Se-labeled selenoproteins were visualized by autoradiography after SDS electrophoresis in control and ΔTrsp macrophage as shown in the right panel. Left panel shows Coomassie Blue stained gel which served as a loading control. The identities of the major, labeled selenoproteins are designated on the right of the panel. In (D), macrophages were stained with DCFDA and ROS production analyzed by confocal microscopy. Fluorescence (left panels) and phase contrast (right panels) images are shown. In (E), macrophages were stained with DCFDA and ROS production analyzed by flow cytometry. Experimental details of the studies shown in this figure are given in Carlson et al.(22)

