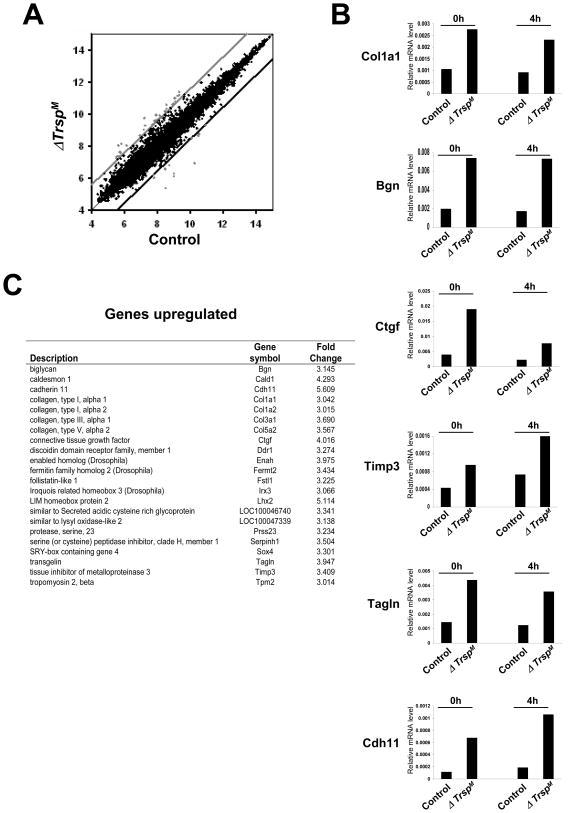
Fig. 6. Microarray analysis of ΔTrspM macrophages.
In (A), genes that were upregulated and downregulated in ΔTrspM macrophages are shown in the scatter plot. The ordinate and abscissa represent logarithmic values of the signal intensity of individual microarray spots. The upper and lower cut-off lines illustrate the margins of gene expression ratio wherein 3-fold or higher upregulated genes (spots above the light gray line) and 3-fold or lower downregulated genes (spots below the dark black line) are shown as outside the upper and lower cut-off lines, respectively. In (B), those genes whose expression levels were identified in DNA microarray analysis manifesting an alteration greater than 3-fold were validated by real-time PCR. The relative expression of genes in macrophages that were either untreated or treated with LPS is shown. In (C), expression of genes and protein products that were upregulated by selenoproteins is shown. Experimental details of the studies shown in this figure are given in Carlson et al.(22)

