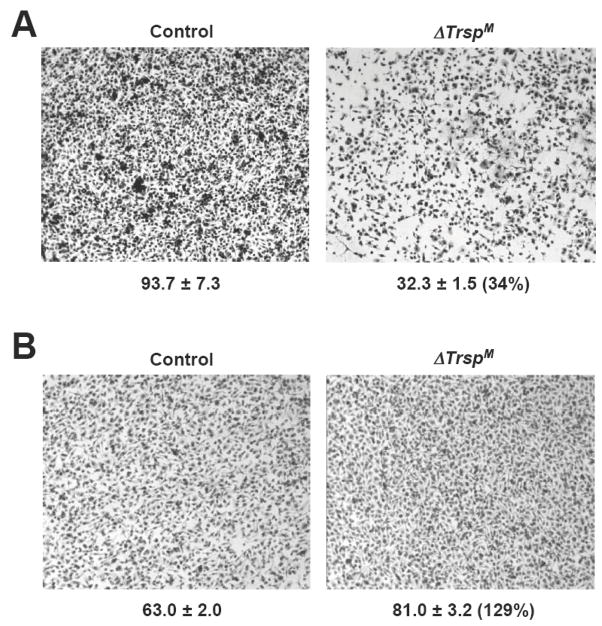
Fig. 7. Analysis of ΔTrspM macrophage invasion in a protein gel matrix.
In (A), macrophage migration was examined by a transwell assay with a protein gel matrix (Matrigel) layer in the upper chamber. Numbers below each panel indicate the relative migration of macrophages and they represent the mean ± standard deviation (n=3). Numbers in parenthesis indicate percentage of cell migration in the ΔTrspM sample relative to the control sample. In (B), macrophage migration was examined by a transwell assay in the absence of a Matrigel layer and the data presented as in A. Experimental details of the studies shown in this figure are given in Carlson et al.(22)

