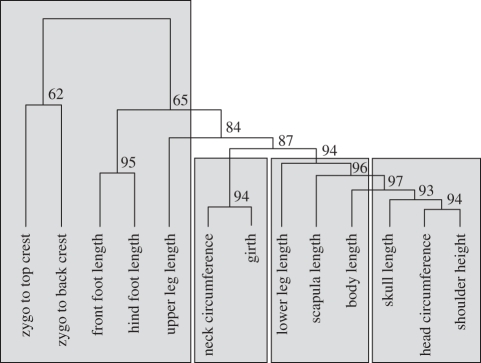
Figure 2.
Cluster diagram from hierarchical cluster analysis on univariate measures. Cluster analyses were performed using five different agglomeration methods, and distance measures calculated from uncentred correlations. Shaded regions designate groups of traits that are returned by four out of five agglomeration methods. The exact topology shown was returned by two out of five agglomeration methods.

