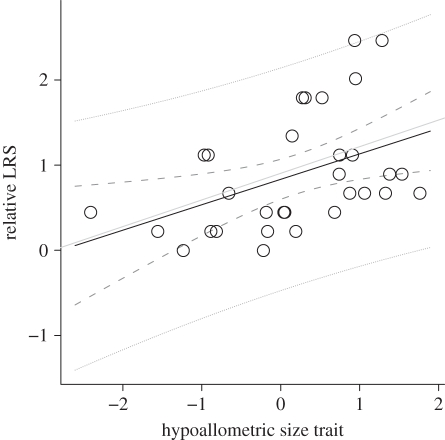
Figure 3.
Relationship between relative LRS and the standardized hypoallometric size trait observed among 31 female spotted hyenas. The black line indicates the selection differential, whereas the grey line indicates the selection gradient. The dashed lines indicate the 95% CIs while the dotted lines are the 95% predictive intervals.

