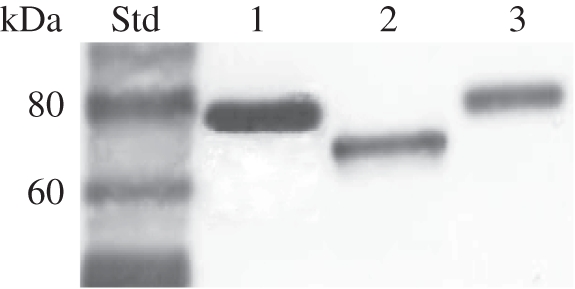
Figure 3.

Western blot of heterologously expressed SAOs in Sf9 insect cells. Lanes 1 and 2 correspond to the P. vitellinae SAO. Size differences are due to a PNGase F treatment of probe 2 (lane 2), suggesting post-translational N-glycosylations. Chrysomela populi SAO is blotted (lane 3), demonstrating a similar size of the SAO in both genera after expression.
