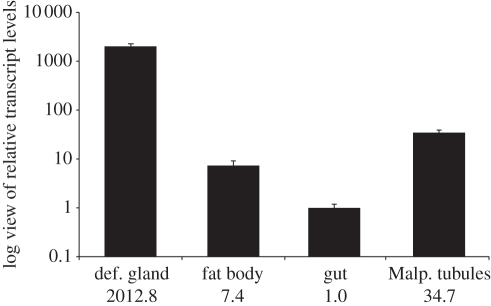
Figure 5.
Expression pattern of P. vitellinae SAO. Relative transcript levels in different larval tissues display glandular tissue specificity of the SAO with an approximately 2000-fold higher transcript abundance compared with fat body, gut and Malpighian tubules. Transcript levels are indicated logarithmic and average values are shown below each column. For normalization of transcript quantities, EF1α and eIF4A were used. Error bars indicate the SEM.

