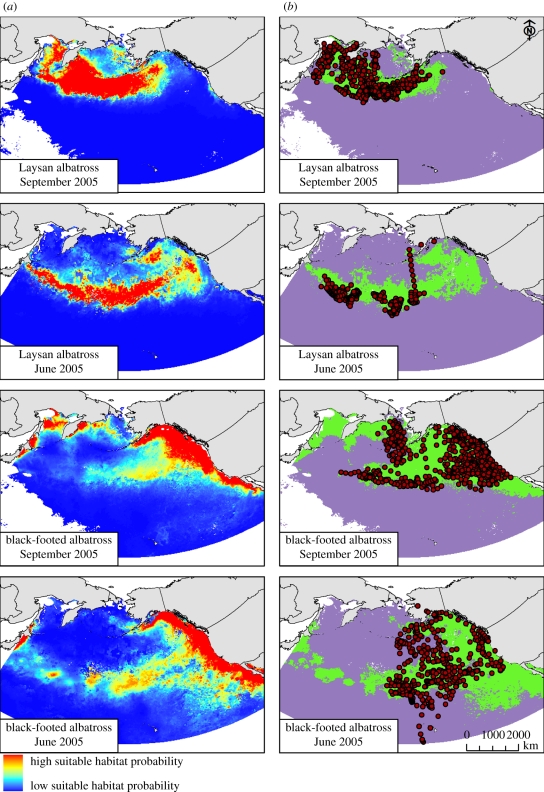
Figure 2.
Examples of dynamic habitat model performance: (a) predictive habitats maps and (b) observed tracking locations overlaid over binary habitat suitability maps of Laysan and black-footed albatrosses during June and September of the year 2005. Binary habitat suitability maps differentiate model predictions using the cut-off point of ROC curve. Purple regions, unsuitable habitat; green regions, suitable habitat; red circles, bird tracking fixes.

